
- Home >
- Stock Photos >
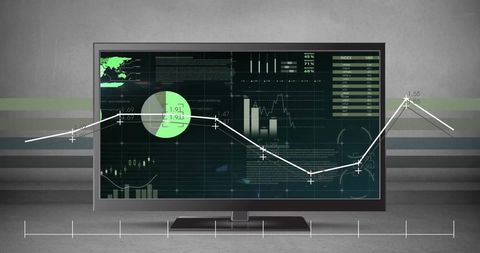
- Digital Data Analytics Display Interface with Graphs and Charts
Digital Data Analytics Display Interface with Graphs and Charts Image

This innovative display showcases a digital interface encompassing diverse data analytics with charts, graphs, and statistics pivotal for global business analysis. Ideal for use in technology blogs, corporate presentations, or educational content focusing on data analysis and processing techniques in modern business ventures.
Powered by 


downloads
Tags:
More
Credit Photo
If you would like to credit the Photo, here are some ways you can do so
Text Link
photo Link
<span class="text-link">
<span>
<a target="_blank" href=https://pikwizard.com/photo/digital-data-analytics-display-interface-with-graphs-and-charts/99c655bdbaf2236f553938c44e835561/>PikWizard</a>
</span>
</span>
<span class="image-link">
<span
style="margin: 0 0 20px 0; display: inline-block; vertical-align: middle; width: 100%;"
>
<a
target="_blank"
href="https://pikwizard.com/photo/digital-data-analytics-display-interface-with-graphs-and-charts/99c655bdbaf2236f553938c44e835561/"
style="text-decoration: none; font-size: 10px; margin: 0;"
>
<img src="https://pikwizard.com/pw/medium/99c655bdbaf2236f553938c44e835561.jpg" style="margin: 0; width: 100%;" alt="" />
<p style="font-size: 12px; margin: 0;">PikWizard</p>
</a>
</span>
</span>
Free (free of charge)
Free for personal and commercial use.
Author: Awesome Content
Similar Free Stock Images

Premium


Premium

Premium


Premium


Premium


Premium


AI


Premium

Premium

Premium


Premium

Premium


Premium

Premium

Premium

AI


Premium

AI


Premium


Premium


Premium

Premium

Premium


Premium


AI


Premium


Premium

AI


Premium


Premium


Explore More Free Stock Images