1. Home > 
  2. Stock Photos > 
  3. Digital Data Analytics Graphs with Blue Background

Digital Data Analytics Graphs with Blue Background Image

Digital Data Analytics Graphs with Blue Background

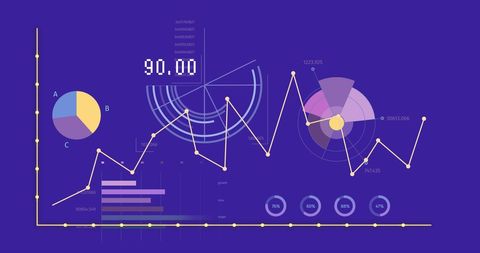
This visualization depicts graphs and charts representing digital data analytics against a blue background. Ideal for illustrating concepts related to data analysis, business intelligence, technology advancements, or financial analysis in presentations, reports, or online content.

Powered by Shutterstock logo - Get 15% off with code: PIKWIZARD15
Data analytics dashboard with charts, indicators, and performance metrics, reveals trends, data analytics drives growth, supports insight, and data analytics improves decisions. Latch - Powered by Shutterstock - Get 15% off with code: PIKWIZARD15Data insights, charts, and analytics help visualize performance. Data drives strategy, analytics enhances growth, and data improves business outcomes through analytics. Vouch - Powered by Shutterstock - Get 15% off with code: PIKWIZARD15Analyst utilizing technology and dashboard with charts data science and Big Data technology for business, Strategic data management system with KPI organization performance with technology and metrics - Powered by Shutterstock - Get 15% off with code: PIKWIZARD15AI web analytics and marketing prediction analysis. Artificial intelligence analyzing customer behavior data. Data scientist using laptop computer to give instructions to AI. - Powered by Shutterstock - Get 15% off with code: PIKWIZARD15Businessman analyzing digital dashboard with futuristic charts and diagrams on transparent virtual screen, concept of data analysis - Powered by Shutterstock - Get 15% off with code: PIKWIZARD15

Credit Photo

If you would like to credit the Photo, here are some ways you can do so

Free (free of charge)

Free for personal and commercial use.

Author: People Creations

Similar Free Stock Images

Healthcare and Finance Synergy with Data Visualization
Premium
Data analytics and big data strategy for real-time analytics, predictive data modeling, business intelligence analytics, and data-driven decision-making in modern digital businesses. Thunk
Digital Interface with Data Sharing and Connection Network
Premium
Data analytics automated with AI technology. Big data, business analytics and artificial intelligence automation. Dashboard report with sales and operations charts and KPI insights on touch screen.
Futuristic Neon Tunnel with Vibrant Pink Geometric Shapes
Digital Data Processing Interface with Charts and Algorithm Visuals
Digital Finance Data with Icon Overlay on Blue Background
Premium
Data analytics and big data strategy for real-time analytics, predictive data modeling, business intelligence analytics, and data-driven decision-making in modern digital businesses. Spline
Premium
Business 2025 graphs statistics to analyze business potential concepts, Businesswomen use tablet analytics charts, forecast future, Marketing targets growth to optimize performance for profit.
Premium
Professional examines tablet device displaying advanced data analytics hologram, emphasizing technology role in modern business strategy and decision making. Tessel
Ukrainian Crisis Economic Data and Analytics Display
Network of Connections and Financial Data on Graph
Violet Data Dashboard Visualizing Global Analytics with Pie Charts and Candlestick Graphs
Premium
Analyst working with business analytics and data management system on computer, make a report with KPI and metrics connected to database. Corporate strategy for finance, operations, sales, marketing
Futuristic Digital DNA Helix with Data Connections
Complex Mathematical Illustrations on Gradient Background
Digital DNA Strand with Dynamic Particle Swirl on Dark Background
Abstract Mathematics Formulae on Gradient Background
Financial Data Analysis with Graphs and Charts on Dark Background
Mathematical Formulas and Graphs on Gradient Background
Secure Data Analytics with Financial Graphs and Padlock Over Ukraine Flag
Abstract Digital Interface with Data Streams and Network Connections
Financial Data Analytics Over Equatorial Guinea Flag
Data Analysis Interface with Charts and Statistics on Digital Screen
Financial Data Trends Merging with EU and Ukraine Flags
Colorful Financial Data Analytics and Digital Graph
Premium
concept of data economic growth through a graph chart. Business strategy. Digital marketing and stock market.
Premium
Data analytics dashboard with charts, indicators, and performance metrics, reveals trends, data analytics drives growth, supports insight, and data analytics improves decisions. Vouch
Data Analytics with World Map and Stock Market Graph Icons
Analyzing Financial Graphs with Real-Time Data Trends
Abstract Mathematical Formulae Over Gradient Background
Dynamic Line Graph with Fluctuating Data on Red Background
Abstract Interface Displaying Colorful Data Visualizations
Mathematical Equations and Floating Message Symbols on Abstract Background
Handwritten Mathematical Graphs and Formulas on Pink Background
Global Financial Data Analytics and Economic Graphs
Data Analytics and Technology on Orange Background
Premium
analyst manages the system database, and analysis data plans, and reports. shows a dashboard chart on the computer. research on platform digital technology. analytics business concept
Mathematical Formulae on Gradient Background for Learning
Global Financial Data Visualizations with Charts and World Map
Abstract Math Formulas and Graphs Pink Background Piece
Innovative Digital Finance Data Display on Dark Interface
Math Formulas on Vibrant Gradient Background
Digital Screen Displaying Stock Market Index Data Trends
Comprehensive Financial Data Analytics Interface with Global Indicators
Digital Financial Data Display with Graphs and Analytics
Globe with Digital Network Connections and Data Indicators
Premium
Two analyst works on a laptop showing data business analysis and Data Management System with KPI and metrics connected to the database for technology finance operations Data Analytics Statistics.
Premium
Data analytics report business strategy, management tools, Stock market indicator or forex trading graph and financial investment.
Abstract Mathematical Equations on Purple Background
Premium
2026 Business finance data analytics graph. Businessmen use smartphone analytics targets and financial management, cost plans, HR, KPI, Corporate strategy finance, operations, sales, Marketin
Abstract Mathematics Equations on Gradient Background
Missile Trajectory Graph on Russian Flag Backdrop
Digital Scope Interface on Orange Gradient Background
Data Analytics Digital Interface with Icons
Premium
Data analytics and big data strategy for real-time analytics, predictive data modeling, business intelligence analytics, and data-driven decision-making in modern digital businesses. Thunk
Digital Financial Data Analysis on Dark Background
Mathematical Formula Handwriting on Gradient Background
Digital Interface with Data Visualization Over Dark Background
Abstract Mathematical Concepts on Gradient Background
Complex Math Formulas on Vibrant Gradient Background
Mathematical Formulas on Pink Background for Learning
Digital Data and Financial Charts on Dark Interface
Handwritten Mathematical Formulas on Gradient Pink Background
Premium
Businessman analyze and visualize complex information on a virtual screen using AI to process data. Big data technology and data science.Data flow.Digital neural network.artificial intelligence
Digital Analytics Visualization with Bar and Line Graphs
Premium
Data analyst working on business analytics dashboard with charts, metrics and KPI to analyze performance and create insight reports for operations management.
Chalk-Drawn Mathematical Diagrams on Pink Background
Futuristic Digital Interface with Global Data Visualizations
Digital Interface with Mathematical Equations and Pie Charts
Digital Financial Data Analysis with Vibrant Graphs
High-Tech Financial Data Analysis Display with Graphs
Mathematical Formulae on Vibrant Pink Background for Learning Concept
Holographic Analytics Interface with Floating Numeric Readouts, Binary and Network Grid
Premium
Business finance data analytics graph chart report. man using laptop computer with digital data of  economic growth , marketing KPI sale report,  financial management technology.
Digital Financial Data and Global Analytics Interface
Premium
Big data and analytics support real-time insights, predictive modeling, and data-driven decisions for business intelligence and growth. Latch
Abstract Data Visualization and Analytics over Black Background
Mathematical Formulae on Gradient Background for Science and Learning
Abstract Digital Graphs Depicting Financial Statistics Analysis
Premium
Analyzing Data Trends with Interactive Dashboards, Professional reviews financial reports, using overlay graphs and data visualizations to interpret key metrics and enhance decision-making strategies
Financial Data Charts & Analysis on Dark Screen
Global Finances and Data Processing With World Map Background
Mathematical Formulas on Gradient Background Illustrating Scientific Concepts
Mathematical Formulas on Gradient Background Concept
Premium
Businessman reading data in bar graph and pie chart form on virtual data analytic dashboard in office. Business analysis for investment and online digital marketing
Mathematical Formulas on Abstract Gradient Background
Mathematical Formulae on Soft Gradient Background
Abstract Financial Data with Icon Integration on Blue Background
Creative Light Bulb Maze for Data Processing and Analysis
Premium
Big data and analytics support real-time insights, predictive modeling, and data-driven decisions for business intelligence and growth. Latch
Premium
Data analytics and big data strategy for real-time analytics, predictive data modeling, business intelligence analytics, and data-driven decision-making in modern digital businesses. Spline
Connecting Points and Math Equations on Colorful Background
Mathematical Formulae on Vibrant Gradient Backdrop
Handwritten Mathematical Formulas on Purple Background
Digital Financial Data Representation with Bar and Line Graphs
Digital Financial Graphs and Data Analysis Visualization
Handwritten Mathematical Formulas on Vibrant Gradient Background
Envelope Icon on Transparent Financial Data Interface
AI
Abstract Digital Circuit Network with Futuristic Design
Basketball Strategy Diagram on Green Background
Abstract Graphic Business Data Visualization
Mathematical Formulas on Gradient Background Signifying Knowledge
Abstract Digital DNA Science on Blue Background
Premium
Data analysts work with computer, analyze business data using statistical graphs, organize workflow data on dashboards or evaluate and measure the effectiveness of business process improvements.
Mathematical Formulas on Gradient Pink Background
Abstract Mathematical Formula Background
Futuristic Data and Communication Wave with Complex Pattern
Geometric Diagrams and Math Formulas on Gradient Background
Abstract Financial Graphs and Statistics on White Background
Handwritten Mathematical Formulae on Colorful Gradient Background
Math Formulas on Gradient Pink Background
Chalkboard Mathematics Concepts on Gradient Background
Futuristic Digital Screen with Global Financial Data Visualization
Premium
Data analyst working on computer To analyze business data with statistical graphs, organize work structures systematically for evaluating and measuring operational efficiency.
Premium
Data analytics and big data strategy for real-time analytics, predictive data modeling, business intelligence analytics, and data-driven decision-making in modern digital businesses. Thunk
Complex Financial Data Visualizations Over Dark Background
Mathematical Formulas on Purple Background Illustrating Scientific Concepts
Innovative Data Visualizations with Graphs and Charts
Digital Business Analytics and Data Processing Interface Visualization
Futuristic Geometric Shapes with Digital Data Display
Digital Stock Market Data with Graphs and Binary Code
Digital Social Media Engagement and Data Analytics Concept
Digital Icons with Financial Data Overlay on Blue Background
Premium
Data analysts work with computer, analyze business data using statistical graph, manage work structure data on dashboard, evaluate and measure the performance of business organizations.
Explore More Free Stock Images