- Home >
- Stock Photos >
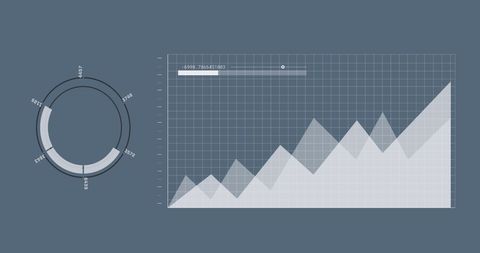
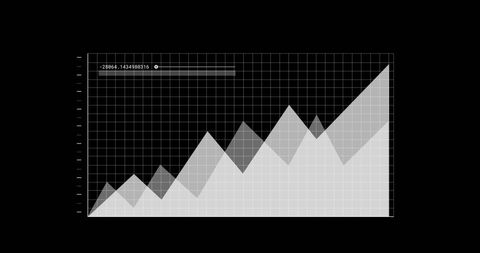
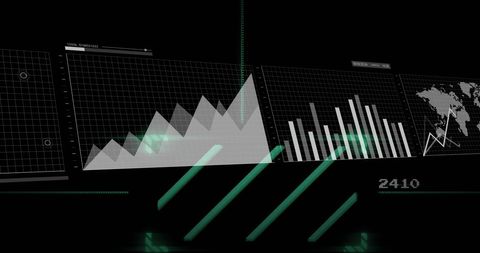
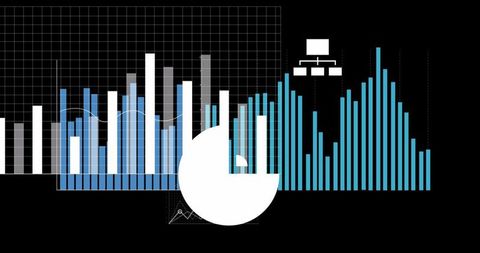
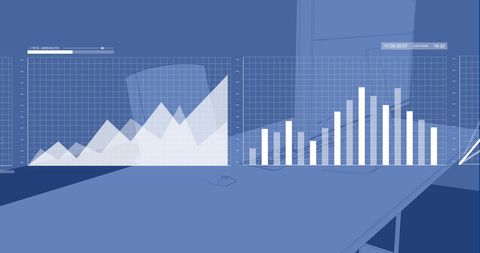
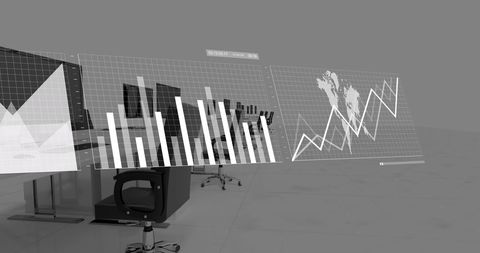
- Digital Data Analytics Interface on Dark Background
Digital Data Analytics Interface on Dark Background Image

Visual illustrates digital data analytics and technology. Features include line graphs, bar charts, and Global map representations on dark backdrop. Ideal for use in marketing materials for business intelligence tools, corporate presentations focusing on data analysis, and educational content about statistics and technology use in commerce.

downloads
Tags:
More
Credit Photo
If you would like to credit the Photo, here are some ways you can do so
Text Link
photo Link
<span class="text-link">
<span>
<a target="_blank" href=https://pikwizard.com/photo/digital-data-analytics-interface-on-dark-background/b5587c69855d343dc2bd5ba5b66f7dc5/>PikWizard</a>
</span>
</span>
<span class="image-link">
<span
style="margin: 0 0 20px 0; display: inline-block; vertical-align: middle; width: 100%;"
>
<a
target="_blank"
href="https://pikwizard.com/photo/digital-data-analytics-interface-on-dark-background/b5587c69855d343dc2bd5ba5b66f7dc5/"
style="text-decoration: none; font-size: 10px; margin: 0;"
>
<img src="https://pikwizard.com/pw/medium/b5587c69855d343dc2bd5ba5b66f7dc5.jpg" style="margin: 0; width: 100%;" alt="" />
<p style="font-size: 12px; margin: 0;">PikWizard</p>
</a>
</span>
</span>
Free (free of charge)
Free for personal and commercial use.
Author: Awesome Content