
- Home >
- Stock Photos >
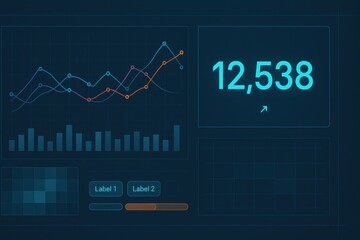
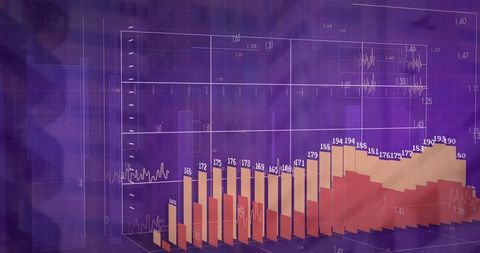
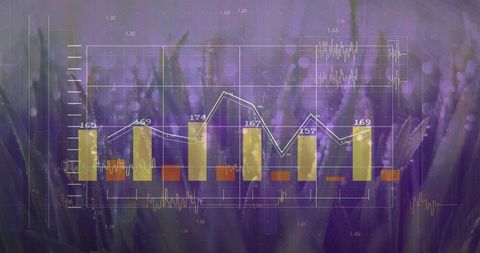
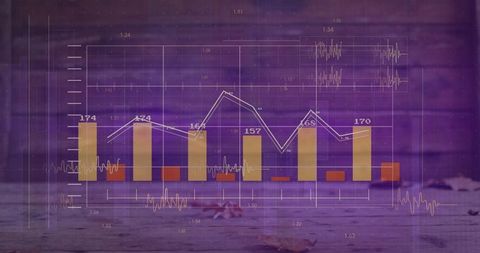
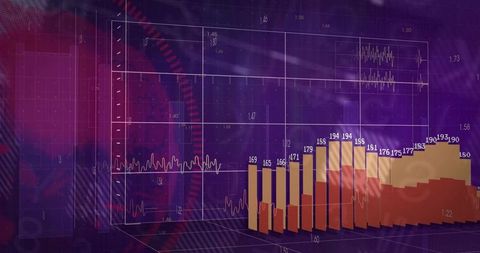
- Digital Data Analytics Interface with Bar and Line Charts
Digital Data Analytics Interface with Bar and Line Charts Image
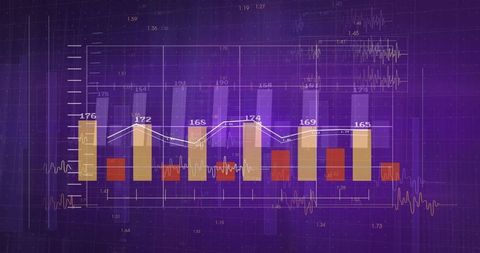
Visualization illustrating data analysis interface featuring bar chart, line graph, and waveforms. Ideal for topics involving technology, finance, and big data analysis, or understanding digital financial trends. Excellent for presentations, educational materials on data science concepts, as well as articles focusing on the overlap between technology and data analysis.
Powered by 


downloads
Tags:
More
Credit Photo
If you would like to credit the Photo, here are some ways you can do so
Text Link
photo Link
<span class="text-link">
<span>
<a target="_blank" href=https://pikwizard.com/photo/digital-data-analytics-interface-with-bar-and-line-charts/d7295dbd15f4a83bd502817eb20c1297/>PikWizard</a>
</span>
</span>
<span class="image-link">
<span
style="margin: 0 0 20px 0; display: inline-block; vertical-align: middle; width: 100%;"
>
<a
target="_blank"
href="https://pikwizard.com/photo/digital-data-analytics-interface-with-bar-and-line-charts/d7295dbd15f4a83bd502817eb20c1297/"
style="text-decoration: none; font-size: 10px; margin: 0;"
>
<img src="https://pikwizard.com/pw/medium/d7295dbd15f4a83bd502817eb20c1297.jpg" style="margin: 0; width: 100%;" alt="" />
<p style="font-size: 12px; margin: 0;">PikWizard</p>
</a>
</span>
</span>
Free (free of charge)
Free for personal and commercial use.
Author: Creative Art
Similar Free Stock Images

Premium


Premium

Premium


Premium


Premium


Premium

Premium


Premium

Premium


Premium


Premium


Premium


Premium


Premium


Premium


Premium


Premium


Premium


Premium


Premium

Premium


Premium


Premium


Premium


Premium

Explore More Free Stock Images