
- Home >
- Stock Photos >
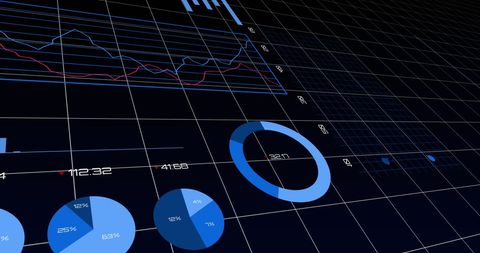
- Digital Data Analytics Interface with Financial Graphs and Charts
Digital Data Analytics Interface with Financial Graphs and Charts Image

Featuring a sophisticated display of financial graphs and data charts, this image illustrates digital analytics in modern finance. The combination of numerical data and interactive graphics represents currency valuations, market trends, and investment opportunities. Ideal for articles or resources focusing on finance technology, data analysis, projections, and global economic trends. Useful also for designing user interfaces or presentations related to finance and technology developments.
Powered by 


downloads
Tags:
More
Credit Photo
If you would like to credit the Photo, here are some ways you can do so
Text Link
photo Link
<span class="text-link">
<span>
<a target="_blank" href=https://pikwizard.com/photo/digital-data-analytics-interface-with-financial-graphs-and-charts/eeee472b24d659fb6592a9f10c4e0de6/>PikWizard</a>
</span>
</span>
<span class="image-link">
<span
style="margin: 0 0 20px 0; display: inline-block; vertical-align: middle; width: 100%;"
>
<a
target="_blank"
href="https://pikwizard.com/photo/digital-data-analytics-interface-with-financial-graphs-and-charts/eeee472b24d659fb6592a9f10c4e0de6/"
style="text-decoration: none; font-size: 10px; margin: 0;"
>
<img src="https://pikwizard.com/pw/medium/eeee472b24d659fb6592a9f10c4e0de6.jpg" style="margin: 0; width: 100%;" alt="" />
<p style="font-size: 12px; margin: 0;">PikWizard</p>
</a>
</span>
</span>
Free (free of charge)
Free for personal and commercial use.
Author: Awesome Content
Similar Free Stock Images
Premium


Premium


Premium

Premium


Premium


Premium


Premium


Premium


Premium


Premium


Premium


Premium

Premium

Premium


Premium

Premium

Premium


Premium


Premium


Premium


Premium

Premium


Premium

Premium


Premium


Explore More Free Stock Images