- Home >
- Stock Photos >
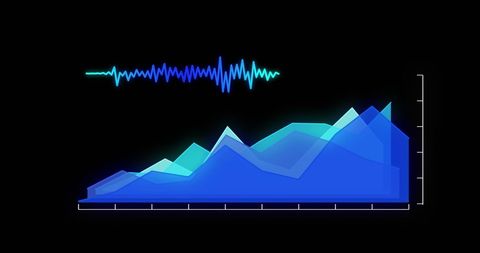
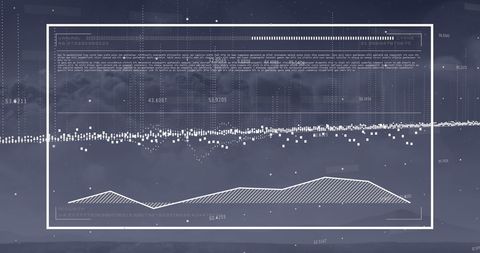
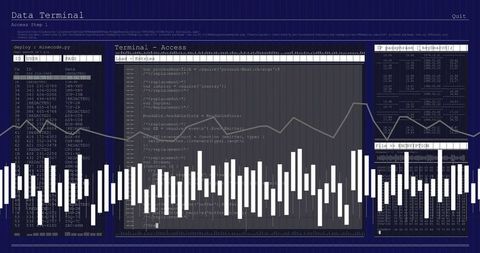
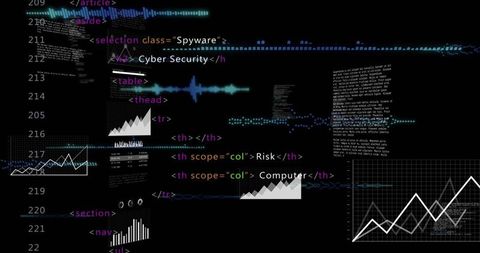
- Digital Data Analytics Interface with Graphs and Code
Digital Data Analytics Interface with Graphs and Code Image

Vibrant portrayal of digital data analytics interface, illustrating financial graphs and coding elements. Ideal for websites and content related to data science, technology development, and financial analysis.

downloads
Tags:
More
Credit Photo
If you would like to credit the Photo, here are some ways you can do so
Text Link
photo Link
<span class="text-link">
<span>
<a target="_blank" href=https://pikwizard.com/photo/digital-data-analytics-interface-with-graphs-and-code/d489260bab82227bd55bb5bc8bc03e83/>PikWizard</a>
</span>
</span>
<span class="image-link">
<span
style="margin: 0 0 20px 0; display: inline-block; vertical-align: middle; width: 100%;"
>
<a
target="_blank"
href="https://pikwizard.com/photo/digital-data-analytics-interface-with-graphs-and-code/d489260bab82227bd55bb5bc8bc03e83/"
style="text-decoration: none; font-size: 10px; margin: 0;"
>
<img src="https://pikwizard.com/pw/medium/d489260bab82227bd55bb5bc8bc03e83.jpg" style="margin: 0; width: 100%;" alt="" />
<p style="font-size: 12px; margin: 0;">PikWizard</p>
</a>
</span>
</span>
Free (free of charge)
Free for personal and commercial use.
Author: Awesome Content