- Home >
- Stock Photos >
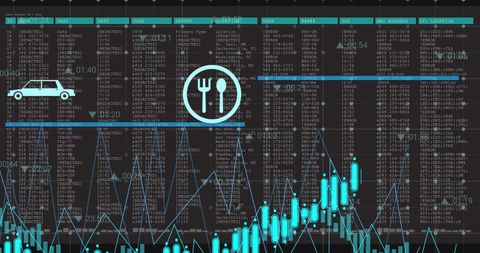
- Digital Data Analytics Interface with Graphs and Numbers
Digital Data Analytics Interface with Graphs and Numbers Image

Digital interface filled with graphs and numerical data against a blue background represents data analytics, technology, and statistics. Ideal for illustrating concepts related to business intelligence, financial analysis, information technology, or data-driven decision-making. Useful for presentations, websites, or publications focusing on technological advancements in data sciences.

downloads
Tags:
More
Credit Photo
If you would like to credit the Photo, here are some ways you can do so
Text Link
photo Link
<span class="text-link">
<span>
<a target="_blank" href=https://pikwizard.com/photo/digital-data-analytics-interface-with-graphs-and-numbers/fabf7a63d204ceef71d53663ab1e2768/>PikWizard</a>
</span>
</span>
<span class="image-link">
<span
style="margin: 0 0 20px 0; display: inline-block; vertical-align: middle; width: 100%;"
>
<a
target="_blank"
href="https://pikwizard.com/photo/digital-data-analytics-interface-with-graphs-and-numbers/fabf7a63d204ceef71d53663ab1e2768/"
style="text-decoration: none; font-size: 10px; margin: 0;"
>
<img src="https://pikwizard.com/pw/medium/fabf7a63d204ceef71d53663ab1e2768.jpg" style="margin: 0; width: 100%;" alt="" />
<p style="font-size: 12px; margin: 0;">PikWizard</p>
</a>
</span>
</span>
Free (free of charge)
Free for personal and commercial use.
Author: Creative Art