1. Home > 
  2. Stock Photos > 
  3. Digital Data Analytics Interface with Turquoise Circular Graph

Digital Data Analytics Interface with Turquoise Circular Graph Image

Digital Data Analytics Interface with Turquoise Circular Graph

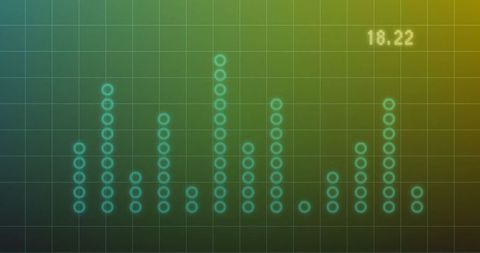
This vibrant visual showcases a futuristic digital interface displaying round data points forming columns on a grid with the number 18.22. Ideal for illustrating concepts related to data visualization, technology solutions, or analytics services. Perfect for presentations, digital marketing, or design projects focused on modern and innovative tech themes.

Powered by Adobe logo
Dynamic stock market chart with vibrant blue and pink bars showing upward trend and financial data visualization in a futuristic digital interface - Powered by AdobeHolographic business dashboard displaying pie chart and bar graph with futuristic blue and orange data visualization - Powered by AdobePersonalized Marketing Strategy. Futuristic digital interface displaying data analytics and customer centric marketing elements such as consumer behavior, customer journey and satisfaction metrics. - Powered by AdobeFuturistic digital dashboard with glowing real estate data, property market trends, and analytics in modern office environment - Powered by AdobeAbstract digital landscape showing glowing data points and an orange trend line rising over a futuristic blue grid with bokeh lighting effects conveying technology and analytics - Powered by Adobe

Credit Photo

If you would like to credit the Photo, here are some ways you can do so

Free (free of charge)

Free for personal and commercial use.

Author: Authentic Images

Similar Free Stock Images

Digital Graphs Displaying Financial Data Analysis in Blue
Premium
Chalkboard Mathematics Concepts on Gradient Background
Ukraine Crisis Financial Graphs Overlay
Dynamic Financial Growth Chart on Digital Screen
Neon Blue Financial Bar Graph on Digital Grid Background
Premium
Statistical Data on Orange Gradient Background
Medical Icons with Cardiograph Digital Interface Concept
Financial Data Analysis Graph with Growing Trends
Data Analytics and Stock Market Graphs
Premium
Graphical Display of Stock Market Trends with Gradient Background
Digital Screen Displaying Stock Market Index Data Trends
Colorful Data Analytics Bar Graphs on Digital Screen
Futuristic Data Recovery Concept on Digital Interface
Premium
Abstract Graphic Business Data Visualization
Dynamic Financial Graphs Illustrating Business Growth
Digital Data Visualization on Pink Grid
Holographic Financial Graphs Over Blue Background
Premium
Abstract Financial Data Visualization with Graphs and Grid Background
Futuristic Cloud Data Visualization with Digital Processing Concept
Abstract Financial Data Processing Blue Grid Background
Futuristic Financial Data Analysis Interface Concept
Premium
Dynamic Financial Data Growth Chart Display
Financial Data Charts with Viewing Grid in Dark Perspective
Dynamic Financial Data Analytics with Stock Market Trends
Data Visualization Dashboard with Interactive Metric Icons
Dynamic Stock Market Indicators and Graphs on Blue Background
Dynamic Financial Data Analysis Illustration
Premium
Digital Data Processing and Encryption Interface Concept
Digital Financial Graph with Rising Line Trend on Dark Background
Digital Financial Chart on Green Background with Figures
Dynamic Financial Data Analysis with Virtual Screen
Premium
Futuristic Digital Data Flow with Glowing Data Streams
Digital Data Analysis with WOW Text Overlay
Rising Financial Graph on Purple Background
Digital Data Graph with Neon Light Points on Green Grid Background
Premium
Digital Visualization Financial Data Growth Progressive Graph
Digital Financial Graph Illustrating Stock Market Trends
Digital Interface with Data Analytics and Processing Visuals
Digital Financial Data Processing with Abstract Graph
Premium
Digital Finance Data with Icon Overlay on Blue Background
Innovative Digital Monthly Growth Chart Background for Data Analysis
Dynamic Financial Graphs with Holographic Elements on Orange Background
Global Financial Data Processing with Digital Interface Elements
Premium
Digital Data Analytics Growth Trend with Graphs
Financial Data Analytics Over Digital Grid Screen
Abstract Data Visualization Digital Chart Background
Data Analytics and Technology on Orange Background
Premium
Abstract Digital Financial Data Graph Chart
Digital Graph and Data Analysis with Financial Growth Trends
Futuristic Digital Analytics with Wi-Fi Data Visualization
Abstract Financial Data Visualization with Floating Numbers
Dynamic Financial Data Elements on Abstarct Grid
Handwritten Mathematical Formulae on Colorful Gradient Background
Premium
Dynamic Financial Graph with Green and Red Candles
Digital Financial Data Graph on Green Grid Background
Abstract Digital Graphs with Circular Flash and Bars
Financial Data Visualization on Digital Grid
Premium
Rising Graphs and Interactive Financial Data Analytics Background
Futuristic Digital Interface with Grid and Data Elements
Statistical Data and Trends Over Digital Grid Overlay
Dynamic Statistical Data Analysis with Gradient Colors
Premium
Financial Data Analysis with Graph and Connectivity
Data Analytics with Dynamic Global Market Trends on Screen
Digital Lock Symbol Overlays Financial Data Highlighting Cybersecurity
Abstract Digital Stock Market Interface with Graphs and Data
Premium
Secure Data Analytics with Financial Graphs and Padlock Over Ukraine Flag
Digital Financial Data Analysis and Stock Market Charting
Stock Market Graph with Social Media Notifications Overlay
Financial Data Analysis with Dynamic Growth Charts
Premium
Financial Stock Market Trends Over Digital Grid Background
Data Visualization with Diagrams on Green Gradient
Dynamic Financial Data Analysis with Growth Indicators
Eco Friendly Charging Concept with Digital Battery Icon
Premium
Interactive Data Visualization with Emerging Analytics Trends
Glowing cyan candlestick bars on dark red analytics grid with energy eco icons
Digital Financial Data and Dynamic Stock Market Graphs
Mathematical Formula Handwriting on Gradient Background
Abstract Financial Market Data Analysis Visualization
Digital Data Processing Graph Interface with Progress Bar
Premium
Circuitry and Data Stream on Digital Grid Background
Abstract Data Visualization on Blue Background
Dynamic Digital Data Visualization of Financial Trends
Dynamic Digital Data and Technology Interfaces
Premium
Dynamic Notification Interface with Stocks and Social Media Alerts
Rising Data Trends on Gradient Graph with Business Insights
Dynamic Lines Show Rising Financial Statistics Over Time
Colorful DNA Strand and Global Data Connection Background
Premium
Abstract Digital Data Visualization with Numbers and Graphs
Analyzing Business Growth with Architectural Backdrop
Abstract Digital Stock Market Analysis with Graphs
Financial Data Processing with Diverse Business Team Collaboration
Premium
Dynamic Financial Data Visualization with Moving Numbers
Dynamic Financial Data Charts and Graphs Background
Innovative Digital Finance Data Display on Dark Interface
Financial Data Analysis with Graphs and Charts on Dark Background
Premium
Dynamic Financial Data Chart on Green Gradient Background
Abstract Digital Interface with Data Bars on Gradient Background
Abstract Digital Data Analysis with Geometric Shapes on Yellow Background
Dynamic Financial Graph with Data Analysis Conceptual Background
Premium
Global Analytics Dashboard Featuring Translucent Earth Globe with Neon Cyan Histogram Grid