
- Home >
- Stock Photos >
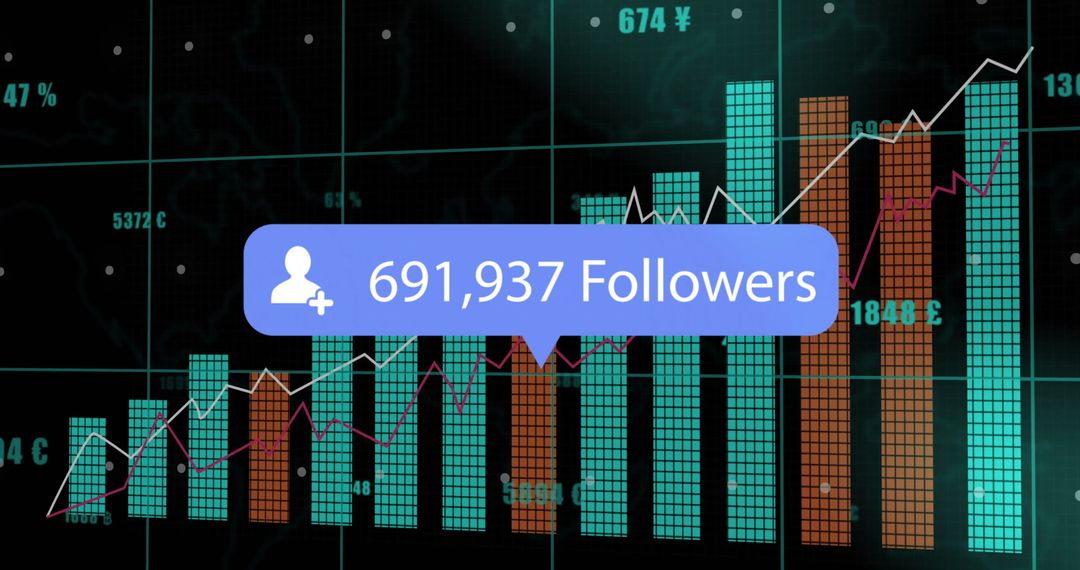
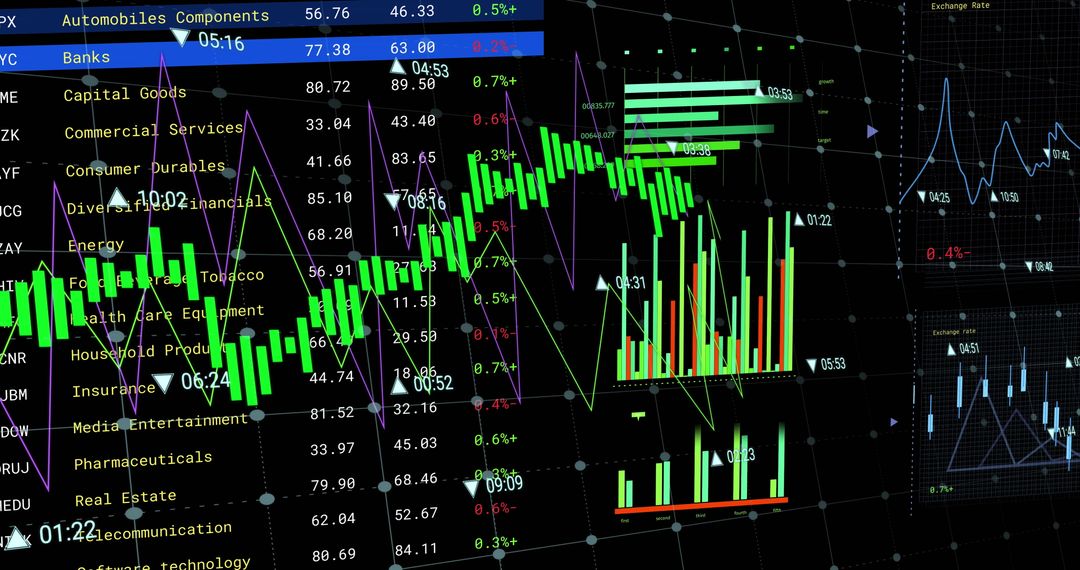
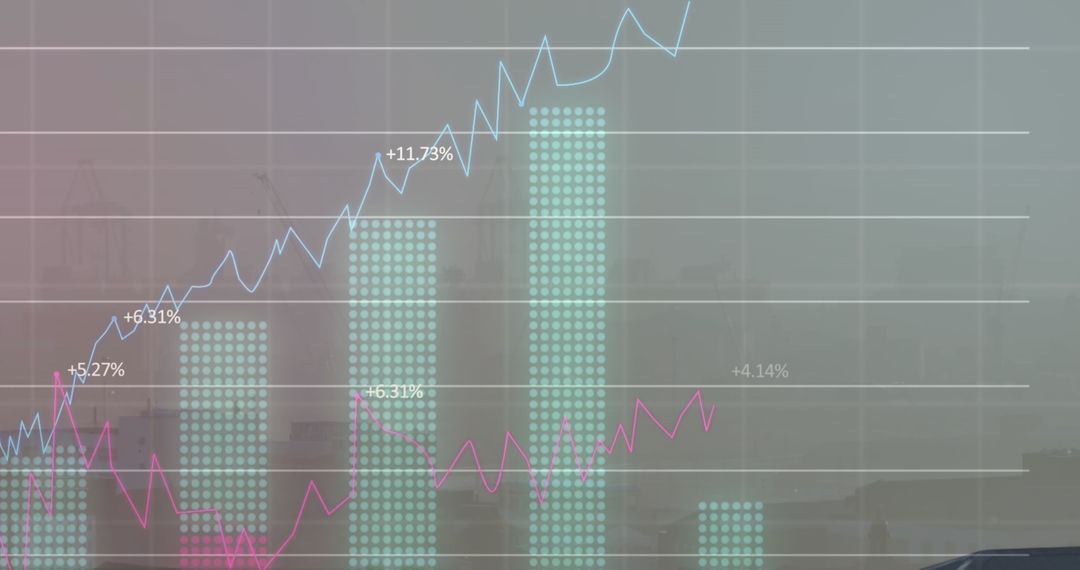
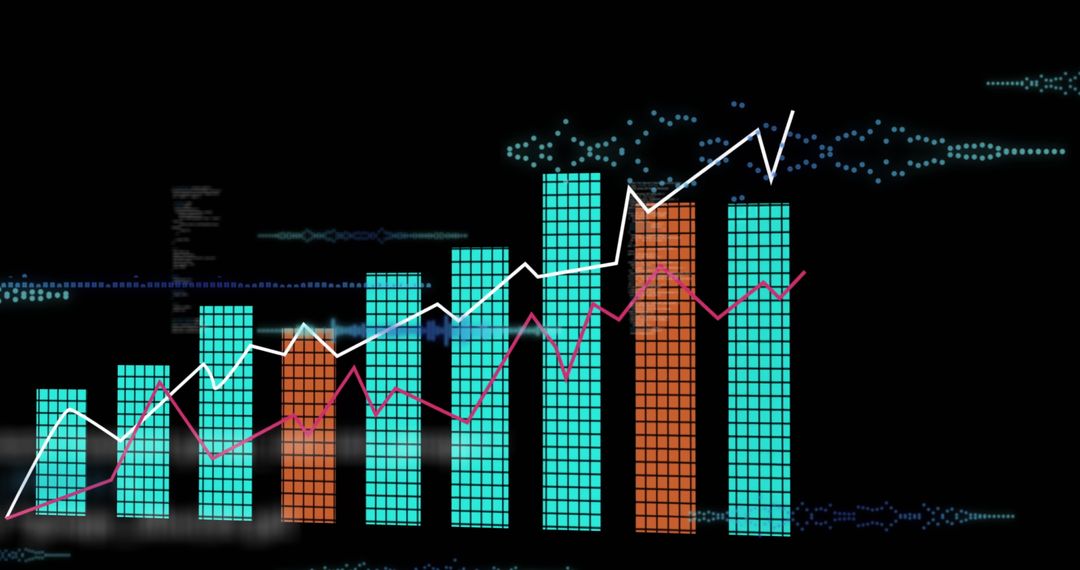
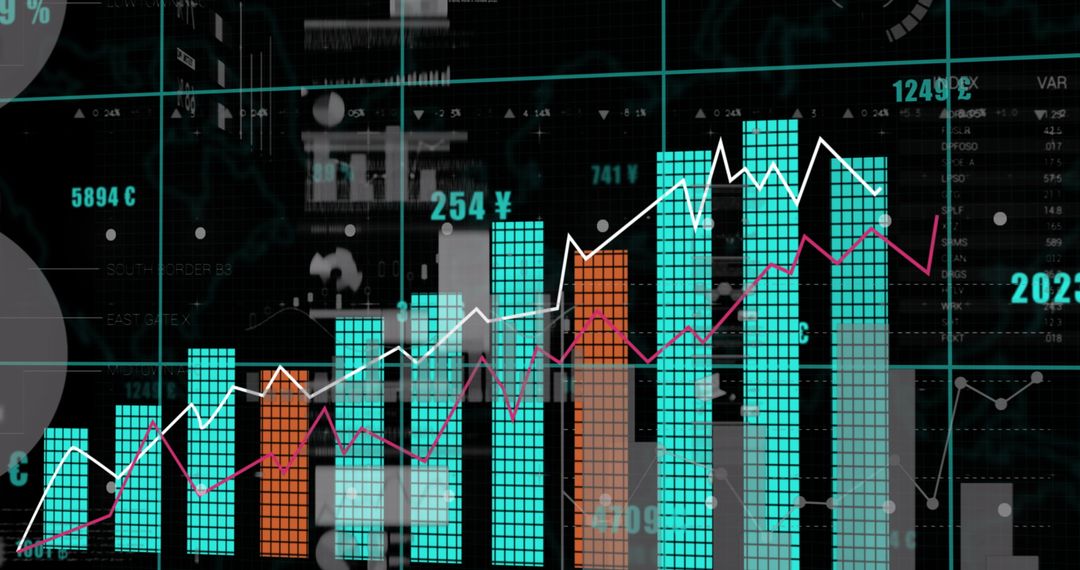
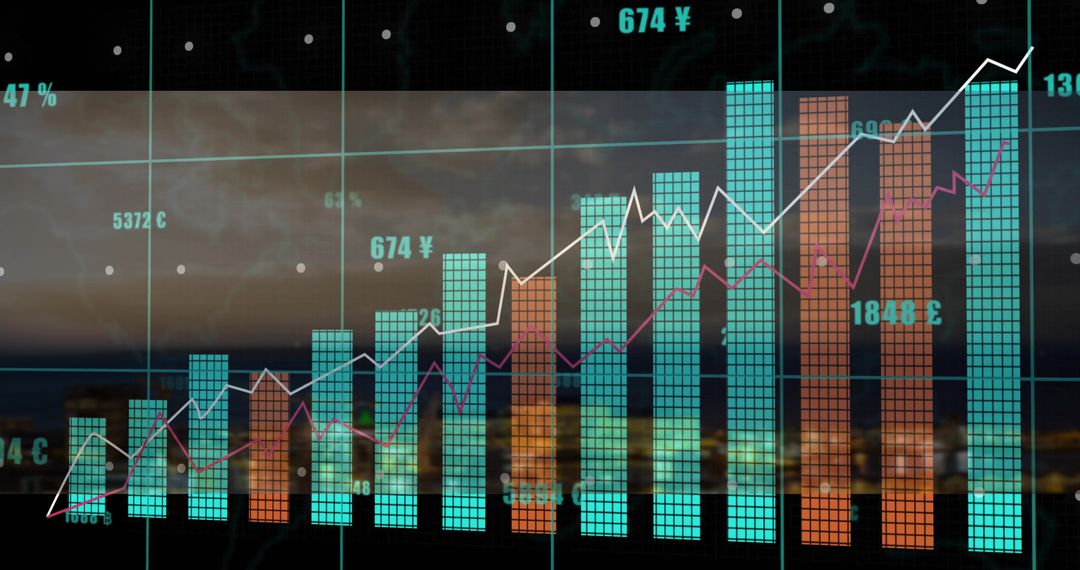
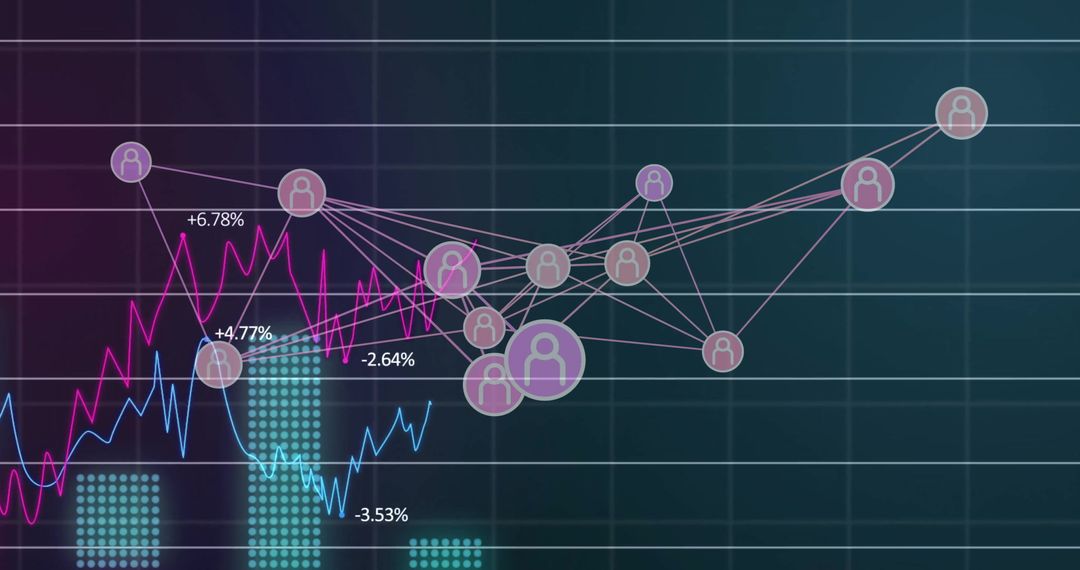
- Digital Data Analytics Showing Bar Graph and Curves on Black Background
Digital Data Analytics Showing Bar Graph and Curves on Black Background Image

Illustrates a modern approach to data monitoring with bar graphs and trend curves displaying fluctuating values, perfect for use in presentations about global finance, stock market analysis, and economic impact visuals. Suitable for enhancing reports, articles, and educational content on financial trends and data evaluation.
Powered by  - Get 15% off with code: PIKWIZARD15


2
downloads
downloads
Tags:
More
Credit Photo
If you would like to credit the Photo, here are some ways you can do so
Text Link
photo Link
<span class="text-link">
<span>
<a target="_blank" href=https://pikwizard.com/photo/digital-data-analytics-showing-bar-graph-and-curves-on-black-background/1a2ed189a3f7e446a717f7bec63494d9/>PikWizard</a>
</span>
</span>
<span class="image-link">
<span
style="margin: 0 0 20px 0; display: inline-block; vertical-align: middle; width: 100%;"
>
<a
target="_blank"
href="https://pikwizard.com/photo/digital-data-analytics-showing-bar-graph-and-curves-on-black-background/1a2ed189a3f7e446a717f7bec63494d9/"
style="text-decoration: none; font-size: 10px; margin: 0;"
>
<img src="https://pikwizard.com/pw/medium/1a2ed189a3f7e446a717f7bec63494d9.jpg" style="margin: 0; width: 100%;" alt="" />
<p style="font-size: 12px; margin: 0;">PikWizard</p>
</a>
</span>
</span>
Free (free of charge)
Free for personal and commercial use.
Author: Creative Art
Similar Free Stock Images

Premium


Premium


Premium


Premium


Premium


Premium


Premium


Premium


Premium


Premium


Premium


Premium


Premium


Premium


Premium


Premium


Premium


Premium


Premium


Premium


Premium


Premium


Premium


Premium

