
- Home >
- Stock Photos >
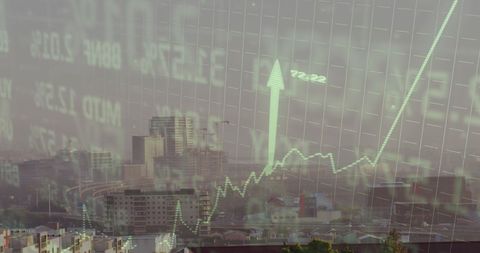
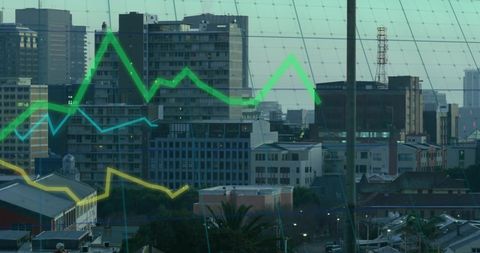
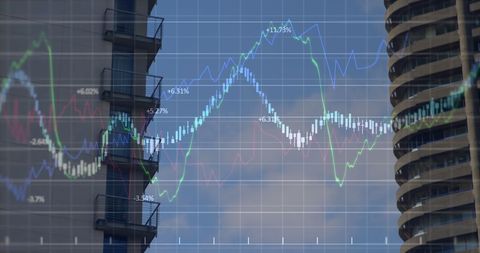
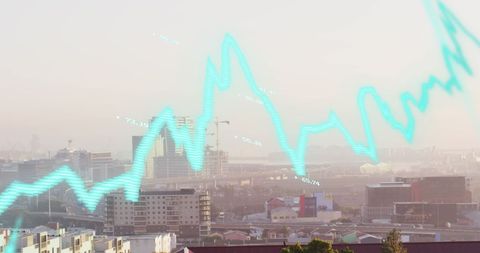
- Digital Data Analytics Visualization Over Modern Cityscape
Digital Data Analytics Visualization Over Modern Cityscape Image

Digital graphic illustrates concept of data processing with complex wave patterns overlaying urban environment. Suitable for showcasing themes of technological advancement, urban development, global connectivity, innovation. Ideal for use in technology publications, urban planning reports, digital marketing imagery focused on modern and smart cities.
Powered by  - Get 15% off with code: PIKWIZARD15


downloads
Tags:
More
Credit Photo
If you would like to credit the Photo, here are some ways you can do so
Text Link
photo Link
<span class="text-link">
<span>
<a target="_blank" href=https://pikwizard.com/photo/digital-data-analytics-visualization-over-modern-cityscape/eff752d3e70148d1bf787c9feade679d/>PikWizard</a>
</span>
</span>
<span class="image-link">
<span
style="margin: 0 0 20px 0; display: inline-block; vertical-align: middle; width: 100%;"
>
<a
target="_blank"
href="https://pikwizard.com/photo/digital-data-analytics-visualization-over-modern-cityscape/eff752d3e70148d1bf787c9feade679d/"
style="text-decoration: none; font-size: 10px; margin: 0;"
>
<img src="https://pikwizard.com/pw/medium/eff752d3e70148d1bf787c9feade679d.jpg" style="margin: 0; width: 100%;" alt="" />
<p style="font-size: 12px; margin: 0;">PikWizard</p>
</a>
</span>
</span>
Free (free of charge)
Free for personal and commercial use.
Author: Awesome Content
Similar Free Stock Images

Premium


Premium


Premium


Premium


Premium

Premium


Premium


Premium


Premium

Premium


Premium

Premium


Premium


Premium


Premium


Premium


Premium


Premium


Premium


Premium

Premium


Premium


Premium


Premium

Premium


Explore More Free Stock Images