1. Home > 
  2. Stock Photos > 
  3. Digital Data Analytics with American Flag Background

Digital Data Analytics with American Flag Background Image

Digital Data Analytics with American Flag Background

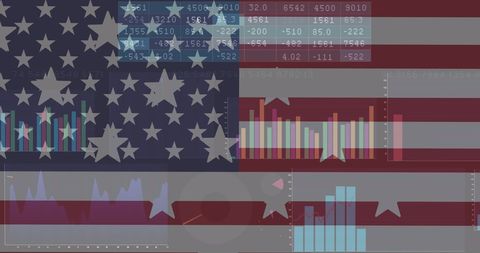
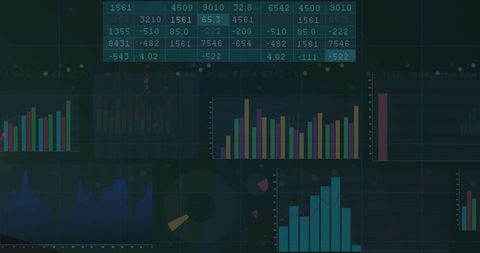
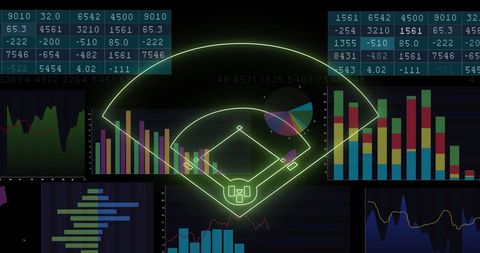
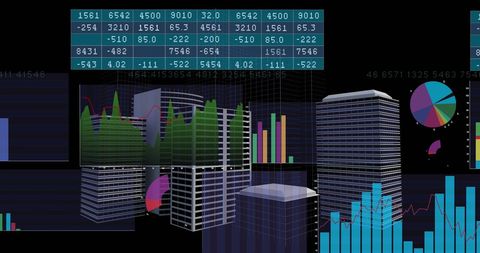
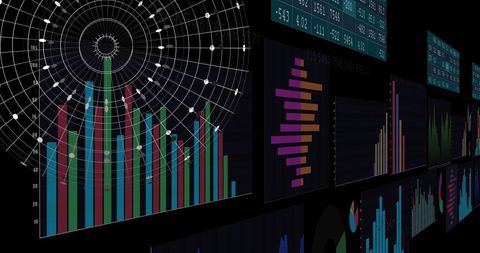
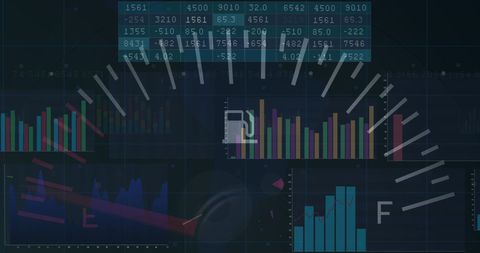
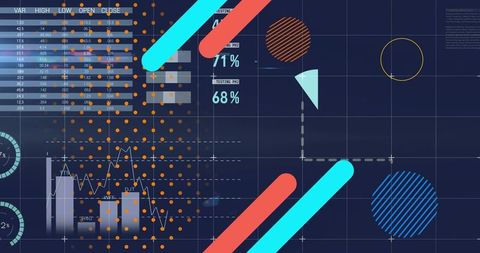
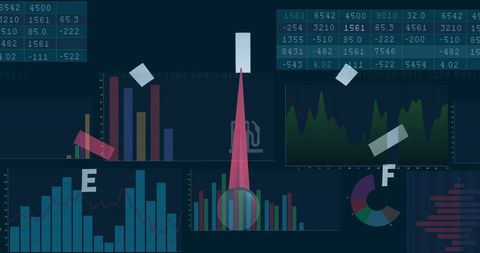
The overlapping digital graphs and charts against the American flag symbolize global business, finance, and data processing. This visualization suits themes like technological advancements in the USA, finance sector innovation, and transnational market analytics. It can enhance presentations on worldwide financial strategies or digital marketing campaigns.

Powered by Adobe logo
African American adult woman digital tablet analyzing global currency exchange data financial market insights managing international business transactions remote home office - Powered by AdobeDigital import tariffs concept with holographic globe on american flag for trade insights - Powered by AdobeUnited States Flag Overlaid on Digital Stock Market Graphs and Financial Data Visualizations - Powered by AdobeUsa financial market data with american flag and percentage symbols - Powered by AdobeDigital financial chart with fluctuating orange line graph over blurred cityscape and American flag colors reflecting economic volatility and uncertainty - Powered by Adobe

Credit Photo

If you would like to credit the Photo, here are some ways you can do so

Free (free of charge)

Free for personal and commercial use.

Author: Authentic Images

Similar Free Stock Images

Financial Data Processing Over Digital Interface and Graphs
Premium
Financial stock market candlestick chart overlaid on waving USA flag with glowing data symbols representing economic business concept and investment trends. Ai generative
Data Analytics Dashboard with Dynamic Charts and Graphs
Futuristic Infographic Commissioning Data Analysis with Graphics
Abstract Digital Financial Data Network Concept
Futuristic Dashboard with Colorful Data Visualization and Analytics
Premium
Futuristic digital stock market chart with American flag hologram and glowing red and blue data lines on financial technology interface
Premium
Money on flags representing international trade and finance with a global digital connection in the background
Digital Financial Data and Analytics over Urban Cityscape
Premium
Falling  market chart overlays a blurred United States flag background.
Digital Data Processing Overlaid on Car Dashboard Interface
Neon Stadium Design with Data Analytics Overlay
Abstract Data Processing Over Car Dashboard Interface
Abstract Financial Graph Display on Dark Background
Premium
A digital display shows a stock market graph alongside the American flag, symbolizing finance and national identity in a modern context.
Global Financial Data Visual Representation with World Map Overlay
Digital Financial Data and Global Analytics Interface
American Themes with Charts in Background
Financial Analytics Display with Digital Graphs and Charts
Premium
Digital representation of import tariffs with holographic globe and data symbols over american flag
Digital Data Analysis on Digital Interface With Graphs
Abstract American Flag Overlay on Business Data Charts
Digital Financial Dashboard with Analytics and Data Visualization
Data Processing and Analytics Visualization on Digital Interface
Premium
Abstract digital image showing the American flag and glowing holographic globe with data visuals and the text “Import Tariffs,” representing trade, economy, and global business.
Digital Data Interfaces and Global Communication Concepts
Dark Analytics Dashboard Displaying Financial Charts, Metrics and Neon Interface
USA Patriotic Themes with Data Graphics Background
Futuristic Digital Dashboard with Data Driven Insights
Futuristic Data Analytics and Digital Interface Overlay
Futuristic Digital Dashboard Interface with Analytics Graphics
Digital Data Processing Interface with Futuristic Visuals
American Flag Overlayed with Financial Data Visualizations
Premium
A man in a blue suit looks up intently on a financial trading floor, surrounded by multiple glowing data screens and an American flag.
Visionary Financial Data Analysis on Digital Interface
Digital Interface with Analytics Graphs and Pie Chart Visualization
Digital Data Processing and Global Networking Visualization
Global Financial Data and Mathematical Integration Concept
Digital Data Analysis Interface on Futuristic Car Dashboard
Digital Projection of Financial Data with Bar Graphs
Fuel Gauge and Statistical Data Visualizations
Digital Dashboard with Data Trends and Chat Technology Elements
Global Social Media Engagement and Followers Growth Online Visualization
Displaying navy grid data dashboard with charts, percent readouts, gauges, abstract visuals
Business Technology Interface with Data Diagrams
Digital Financial Overlay on Cityscape Highlighting Data Insights
European Union Flag Overlay on Data Analytics Background
Futuristic Energy Dashboard Interface for Data Visualization
Premium
stock market chart and american flag
Premium
Showing candlestick and line graph on interface with US flag stripes, star field, green node grid
Dynamic Financial Data Analysis and Graphs for Market Trends
Futuristic Digital Screen with Global Financial Data Visualization
Digital Interface and Data Visualization Concept
Abstract Financial Data Visualization and Statistics
Premium
Financial market analysis showing American and Russian flags with mountain backdrop in a digital graphic
Global Data Analytics with World Map and Bar Graph
Dynamic Stock Market Visualization on Digital Trading Board
Global Technology Map Overlay with Chinese Flag Elements
Innovative Data Visualizations with Graphs and Charts
Premium
Abstract holographic financial graph overlaying USA flag and cityscape, virtual reality, forex
Premium
Dynamic financial stock market trading data analysis with glowing digital graphs and an American flag background highlighting economic trends
Abstract Financial Data Charts and Graphs on Black Background
Global Data Analytics and Network Visualization on Digital Grid
Digital Data Analysis Over World Map Illustrating Global Connections
Digital World Map with Financial Data Visualizations
Colorful Graph with Data Processing Interface Overlay
Global Financial Data Analytics and Economic Graphs
Belgium Flag Overlay on Financial Data and Charts
Digital Interface Displaying Financial and Data Charts in Blue Tones
Modern Analytics Dashboard with Charts and Trackable Metrics
Digital Financial Data Visualizations on Black Background
Dark Themed Data Analytics Dashboard Interface
Global Financial Data Visualizations with Charts and World Map
Premium
Data visualization technology overlays on American flag, blending finance and patriotism at a digital art exhibition
Premium
A close-up of the American flag overlaid with financial graphs, symbolizing economic trends and market analysis in the United States.
Futuristic Financial Data Analysis Interface Concept
Digital Data Processing Dashboard in Global Connection Visualization
Digital Data Visualization on Automotive Interface
Premium
American flag backdrop with glowing orange waveform and digital grid reflected on a glossy surface, conveying dynamic tension and urgent energy
Futuristic Data Dashboard with Graphs and Numeric Visuals
Abstract Financial Data Overlaying Urban Skyline
Data Analytics with Speedometer Driving Business Innovation
Digital Interface Displaying Global Finance Data Charts
Premium
American Flag Surrounded by Stock Market Data and Graphs Representing Financial Trends and Economic Performance
Digital Finance Analytics in Modern Business Environment
Digital Financial Charting and Data Processing on Black Background
Digital Data Visualization with Geometric and Analytical Charts
Financial Analytics Data Visualization with Graphs and Charts
Premium
American Flag at Sunset: A Patriotic Symbol of Freedom and Pride
Futuristic Data Visualization with Charts and Global Interface
Digital Interface with Stock Market Graphs and Statistics
Digital Social Media Engagement and Data Analytics Concept
Abstract Data Visualization on Digital Dashboard
Premium
Financial technology and artificial intelligence concepts on American flag backdrop featuring a hundred dollar bill
Dynamic Digital Data Visualization with Graphs and Statistics
Digital Vehicle Data Dashboard with Charts and Analytics
Digital Financial Data Processing and Analysis Graphics
Premium
Conceptual image of US economy with American flag and dollar bill overlaid with financial graphs and percentage symbols
Premium
A thoughtful man in a suit examines financial data on a digital interface, with an American flag backdrop, symbolizing analysis and strategy in finance.
Digital Financial Data Analysis on Futuristic Blue Interface
Global data analytics dashboard displaying neon world map with multicolor bar charts
Digital Interface with Global Data Analytics Concepts
Premium
Cybersecurity concept with digital holograms of data protection and user profiles overlaid on waving American flag background symbolizing national security. 3D Rendering
Abstract Graphic Business Data Visualization
Financial Graphs and World Map Illustrating Market Data
Digital Financial Charts Displaying Market Trends and Data
Social Media Reactions Overlaying Data and Analytics Background
Premium
A bold upward arrow surging over an orange analytical wave chart on a dark, subtle US flag background. Symbolizes strong economic momentum, recovery, and financial optimism.
Financial Data Visualization with Dynamic Graphs and Charts
Global Financial Data Analysis with Interactive Graphs and Radar
Global Business Analytics and Growth Concept Hologram
Colorful Data Analytics and Statistics Conceptual Graphics
Financial Data Processing with Charts and Graphics on Digital Blue Background
Futuristic Data Analysis Interface with Holographic Displays
Dynamic Financial Data Processing in Modern Analytics
Composite Business Charts with Cafes Interior
Premium
Financial Data Visualization of Stock Market Trends Against American Flag Representing Economic Growth and Investment Opportunities in USA
Financial Data Processing Visualization on Dark Background
Digital Data Processing with Finance Analytics: Global Business Concept
EU Flag Overlay with Financial Data Charts
Digital Dashboard with Financial Graphs and Data Analysis
Premium
Abstract representation of financial market trends and economic data analysis overlaid on a blurred american flag backdrop symbolizing national commerce
Dynamic Data Visualization Depicting Financial Growth Trends
Dynamic Visualizations of Data Analytics and AI Algorithms
American Flag Overlay with Statistical Data Visualization
Explore More Free Stock Images