
- Home >
- Stock Photos >
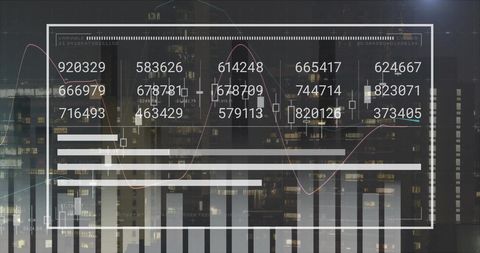
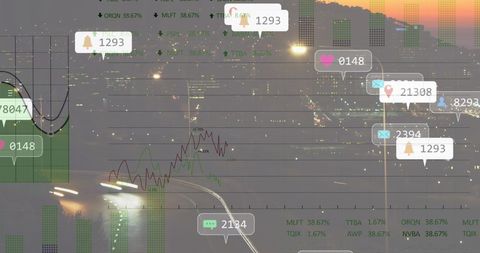
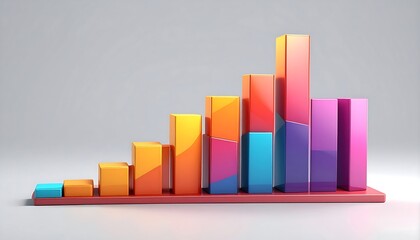
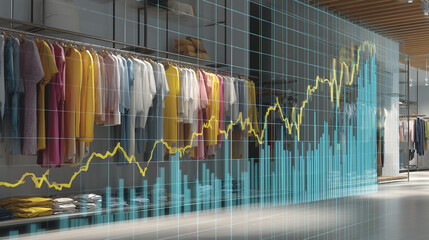
- Digital Data Analytics with Bar Graph and Statistics
Digital Data Analytics with Bar Graph and Statistics Image

Illustration showcasing digital data analytics with prominent bar graph, various statistics embodied through numerical values, and complex graphical background. Ideal for presentations or materials related to data science, global computing, technology consulting, information analysis, and business solutions emphasizing numerical analysis capabilities.
Powered by 


downloads
Tags:
More
Credit Photo
If you would like to credit the Photo, here are some ways you can do so
Text Link
photo Link
<span class="text-link">
<span>
<a target="_blank" href=https://pikwizard.com/photo/digital-data-analytics-with-bar-graph-and-statistics/b66d4235d5c868ba91438c682960faed/>PikWizard</a>
</span>
</span>
<span class="image-link">
<span
style="margin: 0 0 20px 0; display: inline-block; vertical-align: middle; width: 100%;"
>
<a
target="_blank"
href="https://pikwizard.com/photo/digital-data-analytics-with-bar-graph-and-statistics/b66d4235d5c868ba91438c682960faed/"
style="text-decoration: none; font-size: 10px; margin: 0;"
>
<img src="https://pikwizard.com/pw/medium/b66d4235d5c868ba91438c682960faed.jpg" style="margin: 0; width: 100%;" alt="" />
<p style="font-size: 12px; margin: 0;">PikWizard</p>
</a>
</span>
</span>
Free (free of charge)
Free for personal and commercial use.
Author: Creative Art
Similar Free Stock Images

Premium


Premium

Premium


Premium

Premium


Premium


Premium


Premium


Premium


Premium

Premium


Premium


Premium


Premium


Premium


Premium


Premium


Premium

Premium


Premium


Premium

Premium


Premium


Premium


Premium

Explore More Free Stock Images