
- Home >
- Stock Photos >
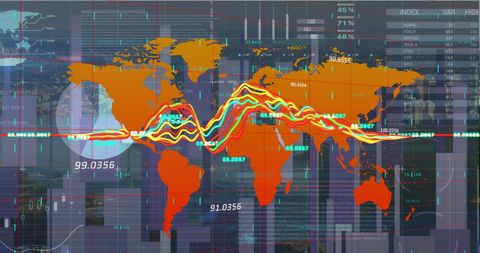
- Digital Data Analytics with Icons and Vibrant Graphs
Digital Data Analytics with Icons and Vibrant Graphs Image

Vibrant interface displaying colorful graphs surrounded by digital icons, representing global business and analytics technology. Useful for illustrating concepts in data analysis, technology integration, and digital development in promotional materials and presentations related to high-tech fields.
Powered by  - Get 15% off with code: PIKWIZARD15


downloads
Tags:
More
Credit Photo
If you would like to credit the Photo, here are some ways you can do so
Text Link
photo Link
<span class="text-link">
<span>
<a target="_blank" href=https://pikwizard.com/photo/digital-data-analytics-with-icons-and-vibrant-graphs/dafd3be897bf5b01762282afce28d900/>PikWizard</a>
</span>
</span>
<span class="image-link">
<span
style="margin: 0 0 20px 0; display: inline-block; vertical-align: middle; width: 100%;"
>
<a
target="_blank"
href="https://pikwizard.com/photo/digital-data-analytics-with-icons-and-vibrant-graphs/dafd3be897bf5b01762282afce28d900/"
style="text-decoration: none; font-size: 10px; margin: 0;"
>
<img src="https://pikwizard.com/pw/medium/dafd3be897bf5b01762282afce28d900.jpg" style="margin: 0; width: 100%;" alt="" />
<p style="font-size: 12px; margin: 0;">PikWizard</p>
</a>
</span>
</span>
Free (free of charge)
Free for personal and commercial use.
Author: Awesome Content
Similar Free Stock Images

Premium


Premium


Premium


Premium


Premium


Premium

Premium


Premium


Premium


Premium


Premium


Premium


Premium


Premium


Premium


Premium

Premium

Premium


Premium

Premium


Premium

Premium


Premium

Premium

Premium


Explore More Free Stock Images