- Home >
- Stock Photos >
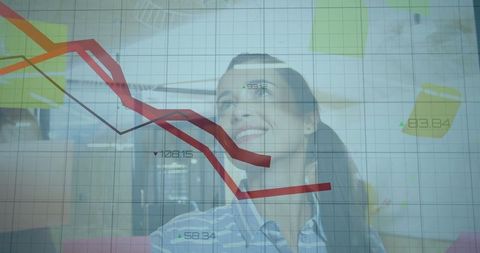
- Digital Data Analyzing Over Book Backdrop
Digital Data Analyzing Over Book Backdrop Image

Graphs and charts overlaying a stack of books symbolize powerful links between digital analytics and traditional knowledge. Could be helpful to visually emphasize themes of growth, research in learning, innovation for business strategies, or intersections of technology with education systems.

downloads
Tags:
More
Credit Photo
If you would like to credit the Photo, here are some ways you can do so
Text Link
photo Link
<span class="text-link">
<span>
<a target="_blank" href=https://pikwizard.com/photo/digital-data-analyzing-over-book-backdrop/b706e2b6f5cb59708cdbce56cdfd92ed/>PikWizard</a>
</span>
</span>
<span class="image-link">
<span
style="margin: 0 0 20px 0; display: inline-block; vertical-align: middle; width: 100%;"
>
<a
target="_blank"
href="https://pikwizard.com/photo/digital-data-analyzing-over-book-backdrop/b706e2b6f5cb59708cdbce56cdfd92ed/"
style="text-decoration: none; font-size: 10px; margin: 0;"
>
<img src="https://pikwizard.com/pw/medium/b706e2b6f5cb59708cdbce56cdfd92ed.jpg" style="margin: 0; width: 100%;" alt="" />
<p style="font-size: 12px; margin: 0;">PikWizard</p>
</a>
</span>
</span>
Free (free of charge)
Free for personal and commercial use.
Author: Awesome Content