- Home >
- Stock Photos >
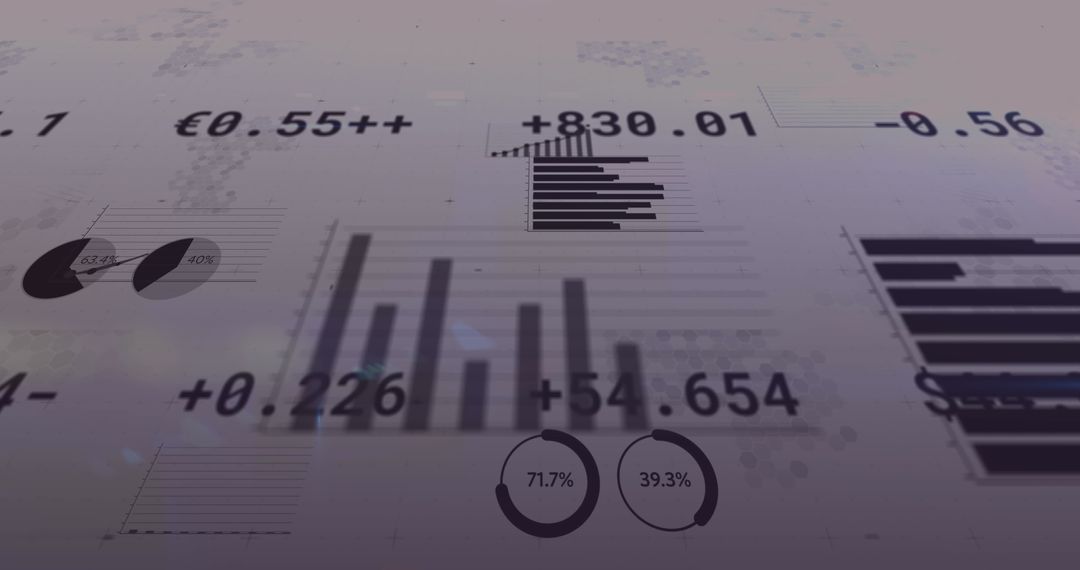
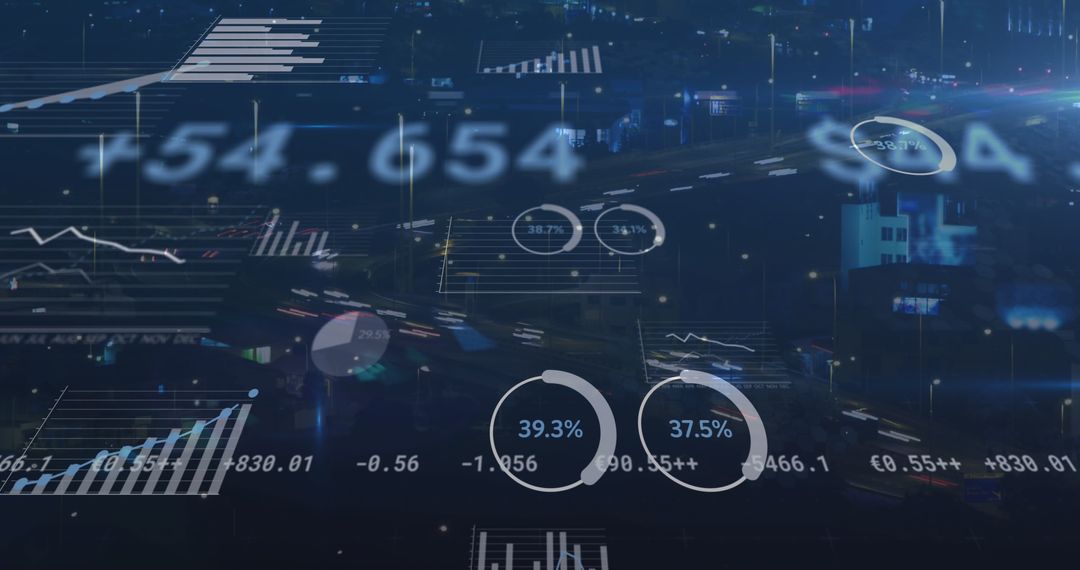
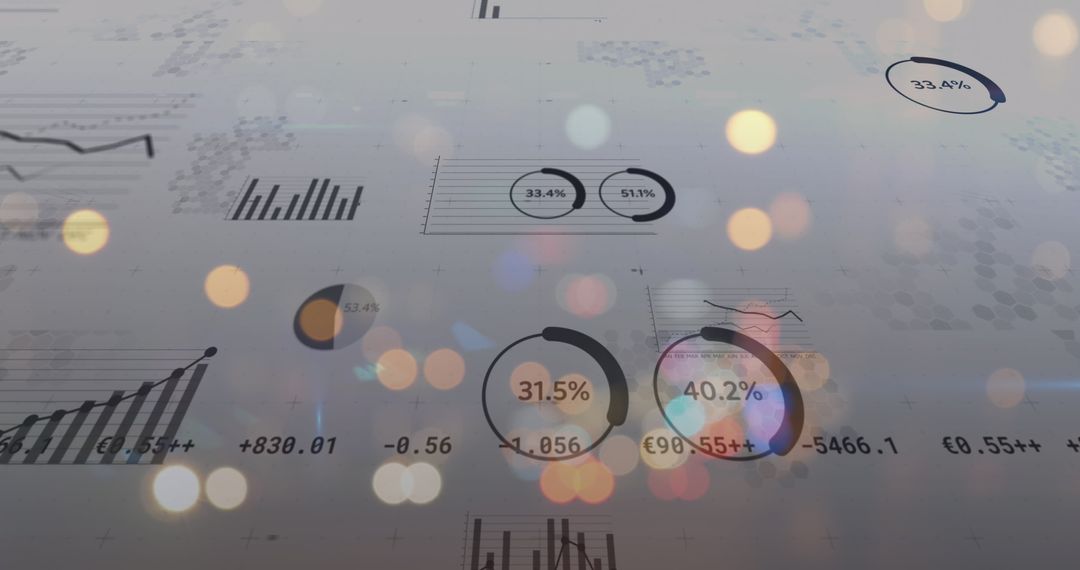
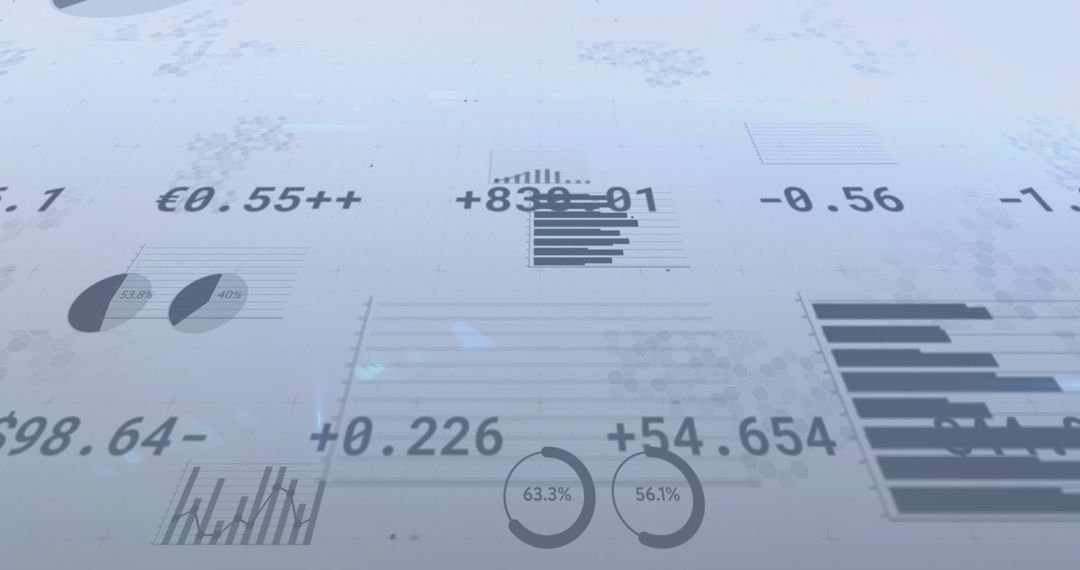
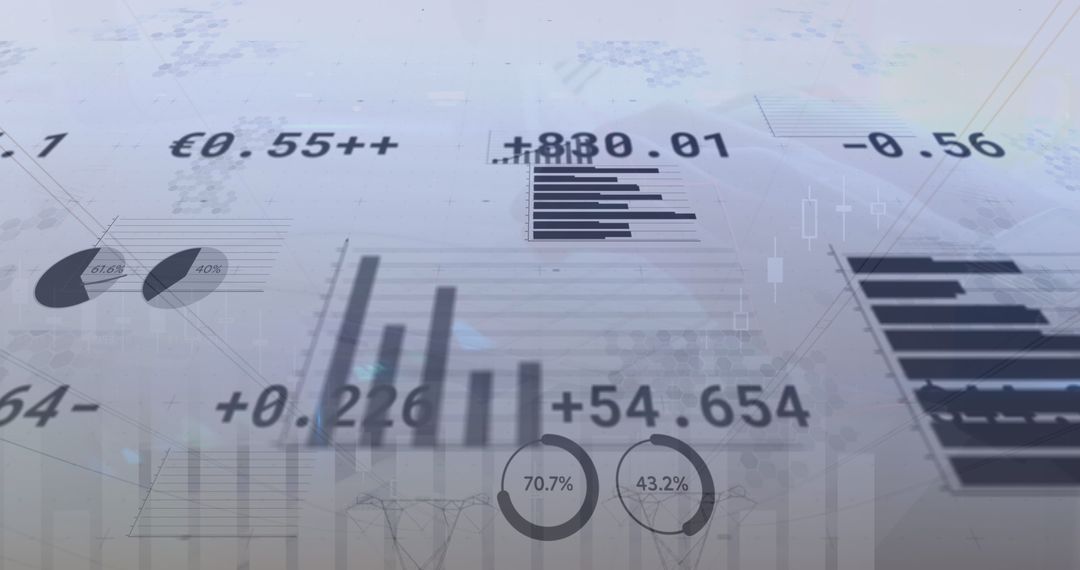
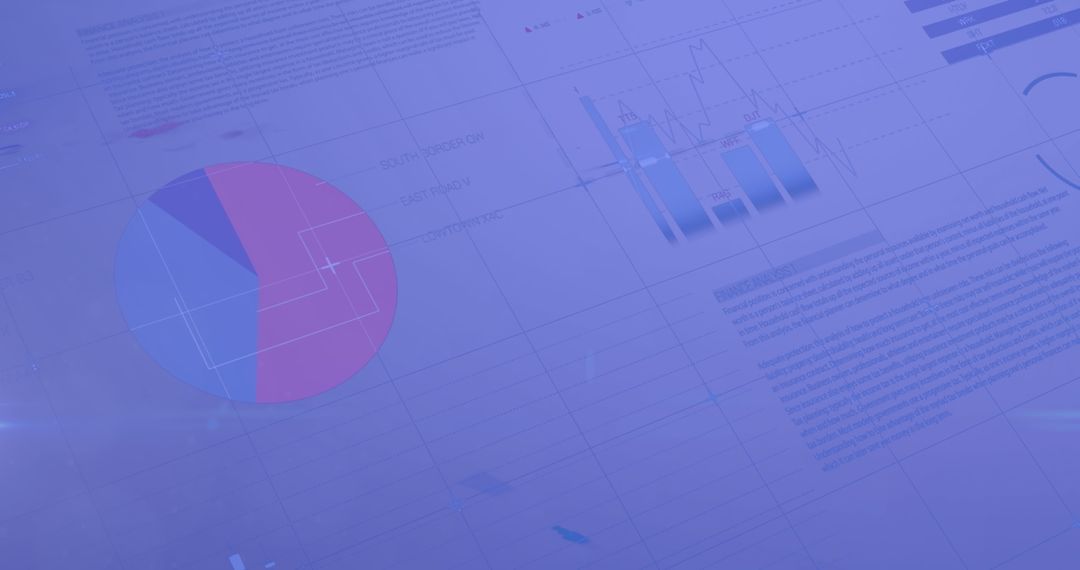
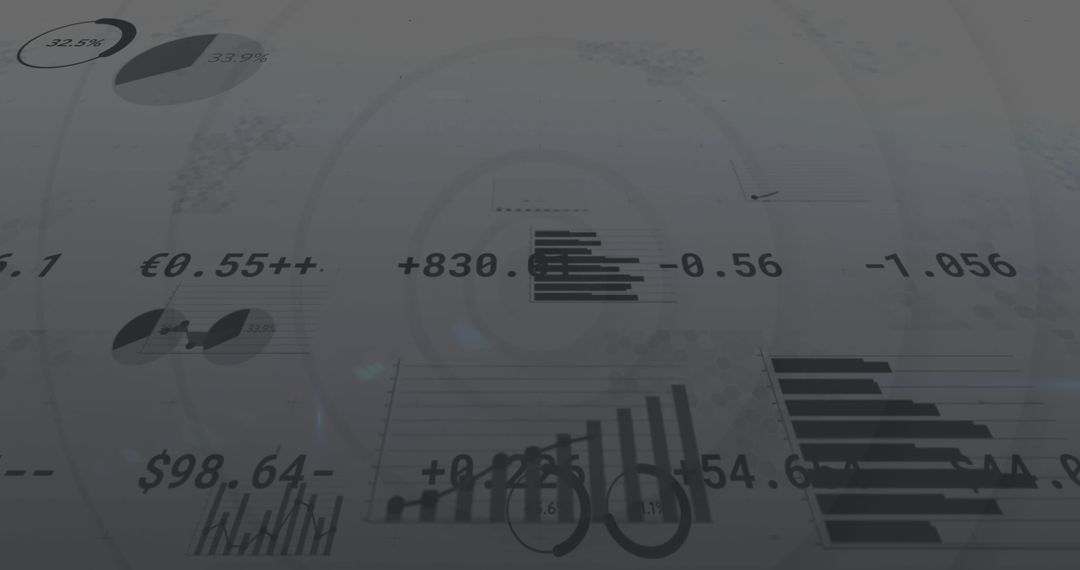
- Digital Data and Chart Analysis in Financial Market
Digital Data and Chart Analysis in Financial Market Image
Visual representation of financial data and charts, showcasing market trends and statistics. Useful for illustrating concepts related to economy and stock market. Ideal for financial reports, business presentations, and investment analyses, emphasizing data analytics and digital transformation in finance.
Powered by  - Get 15% off with code: PIKWIZARD15


2
downloads
downloads
Tags:
More
Credit Photo
If you would like to credit the Photo, here are some ways you can do so
Text Link
photo Link
<span class="text-link">
<span>
<a target="_blank" href=https://pikwizard.com/photo/digital-data-and-chart-analysis-in-financial-market/3767298077c4005ba6ad3f51955efd24/>PikWizard</a>
</span>
</span>
<span class="image-link">
<span
style="margin: 0 0 20px 0; display: inline-block; vertical-align: middle; width: 100%;"
>
<a
target="_blank"
href="https://pikwizard.com/photo/digital-data-and-chart-analysis-in-financial-market/3767298077c4005ba6ad3f51955efd24/"
style="text-decoration: none; font-size: 10px; margin: 0;"
>
<img src="https://pikwizard.com/pw/medium/3767298077c4005ba6ad3f51955efd24.jpg" style="margin: 0; width: 100%;" alt="" />
<p style="font-size: 12px; margin: 0;">PikWizard</p>
</a>
</span>
</span>
Free (free of charge)
Free for personal and commercial use.
Author: Authentic Images
Similar Free Stock Images
Premium


Premium

Premium


Premium


Premium

Premium


Premium


Premium


Premium


Premium


Premium


Premium


Premium


Premium


Premium

Premium


Premium


Premium


Premium


Premium


Premium


Premium

Premium


Premium