
- Home >
- Stock Photos >
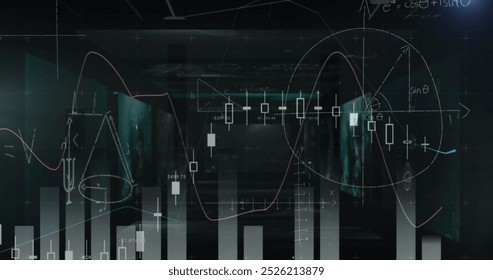
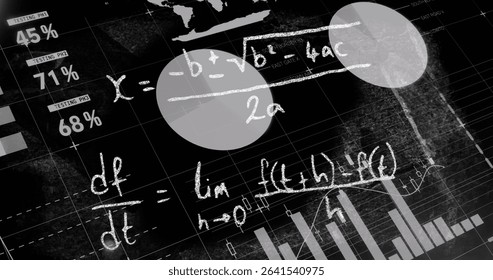
- Digital Data and Mathematical Forecasting Visualization
Digital Data and Mathematical Forecasting Visualization Image
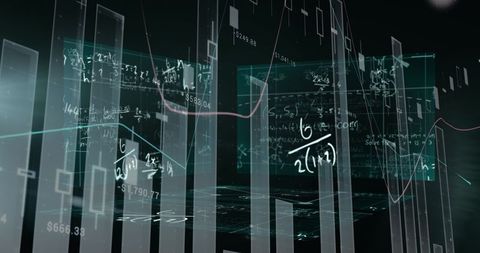
A digital composition showing mathematical formulas and bar graphs on futuristic displays represents the integration of technology and math. Suitable for illustrating concepts in data analysis, artificial intelligence, and machine learning. Useful for presentations, articles, and backgrounds on topics like technological advancements, data prediction, and academic research.
Powered by  - Get 15% off with code: PIKWIZARD15


downloads
Tags:
More
Credit Photo
If you would like to credit the Photo, here are some ways you can do so
Text Link
photo Link
<span class="text-link">
<span>
<a target="_blank" href=https://pikwizard.com/photo/digital-data-and-mathematical-forecasting-visualization/f89375cadbf27e61d8ad9c1b7dacb5be/>PikWizard</a>
</span>
</span>
<span class="image-link">
<span
style="margin: 0 0 20px 0; display: inline-block; vertical-align: middle; width: 100%;"
>
<a
target="_blank"
href="https://pikwizard.com/photo/digital-data-and-mathematical-forecasting-visualization/f89375cadbf27e61d8ad9c1b7dacb5be/"
style="text-decoration: none; font-size: 10px; margin: 0;"
>
<img src="https://pikwizard.com/pw/medium/f89375cadbf27e61d8ad9c1b7dacb5be.jpg" style="margin: 0; width: 100%;" alt="" />
<p style="font-size: 12px; margin: 0;">PikWizard</p>
</a>
</span>
</span>
Free (free of charge)
Free for personal and commercial use.
Author: Awesome Content