- Home >
- Stock Photos >
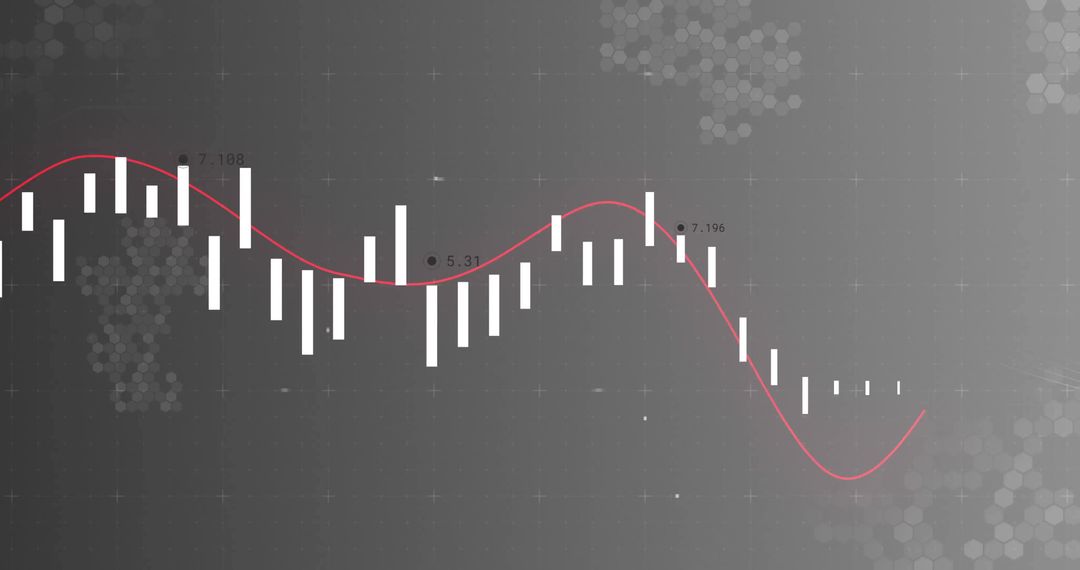
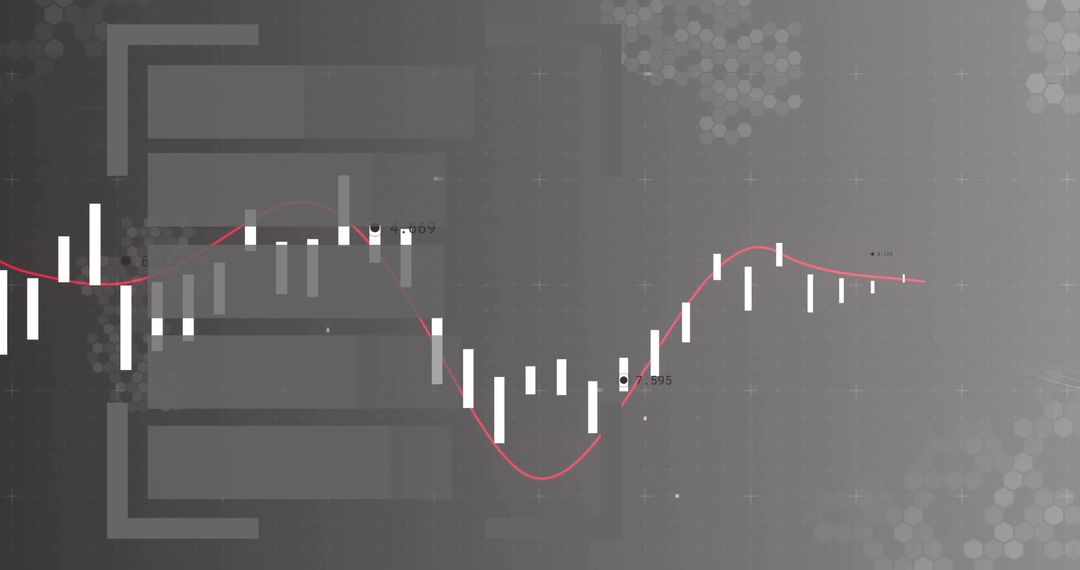
- Digital Data Chart on Grey Background with Red Trend Line
Digital Data Chart on Grey Background with Red Trend Line Image

Visual depicting digital data chart over a grey background features bars and a red trend line indicating economic or financial trends. Ideal for use in presentations, business analytics, technology showcases, or educational materials related to statistics and market analysis.
Powered by  - Get 15% off with code: PIKWIZARD15


2
downloads
downloads
Tags:
More
Credit Photo
If you would like to credit the Photo, here are some ways you can do so
Text Link
photo Link
<span class="text-link">
<span>
<a target="_blank" href=https://pikwizard.com/photo/digital-data-chart-on-grey-background-with-red-trend-line/c59f2208286469f0b91af6e766c38ad7/>PikWizard</a>
</span>
</span>
<span class="image-link">
<span
style="margin: 0 0 20px 0; display: inline-block; vertical-align: middle; width: 100%;"
>
<a
target="_blank"
href="https://pikwizard.com/photo/digital-data-chart-on-grey-background-with-red-trend-line/c59f2208286469f0b91af6e766c38ad7/"
style="text-decoration: none; font-size: 10px; margin: 0;"
>
<img src="https://pikwizard.com/pw/medium/c59f2208286469f0b91af6e766c38ad7.jpg" style="margin: 0; width: 100%;" alt="" />
<p style="font-size: 12px; margin: 0;">PikWizard</p>
</a>
</span>
</span>
Free (free of charge)
Free for personal and commercial use.
Author: People Creations
Similar Free Stock Images

Premium


Premium


Premium


Premium


Premium


Premium


Premium


Premium


Premium


Premium


Premium


Premium


Premium


Premium


Premium


Premium


Premium


Premium


Premium


Premium


Premium


Premium


Premium


Premium