- Home >
- Stock Photos >
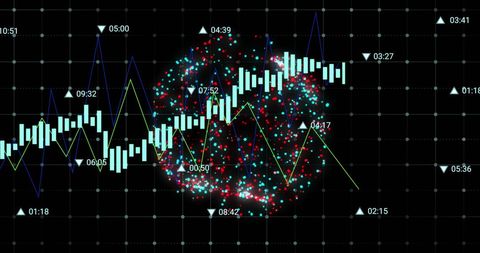
- Digital Data Charts and Graphs over Black Background
Digital Data Charts and Graphs over Black Background Image

Visual represents a digital display of data charts and graphs on a grid network background. Suitable for illustrating concepts in business technology, data analysis, and the stock market. Ideal for use in financial reports, presentations, technology expos, and educational materials focusing on statistical data interpretation.

downloads
Tags:
More
Credit Photo
If you would like to credit the Photo, here are some ways you can do so
Text Link
photo Link
<span class="text-link">
<span>
<a target="_blank" href=https://pikwizard.com/photo/digital-data-charts-and-graphs-over-black-background/e3b86c96b9c8d6452cfa7ab2e0ff7564/>PikWizard</a>
</span>
</span>
<span class="image-link">
<span
style="margin: 0 0 20px 0; display: inline-block; vertical-align: middle; width: 100%;"
>
<a
target="_blank"
href="https://pikwizard.com/photo/digital-data-charts-and-graphs-over-black-background/e3b86c96b9c8d6452cfa7ab2e0ff7564/"
style="text-decoration: none; font-size: 10px; margin: 0;"
>
<img src="https://pikwizard.com/pw/medium/e3b86c96b9c8d6452cfa7ab2e0ff7564.jpg" style="margin: 0; width: 100%;" alt="" />
<p style="font-size: 12px; margin: 0;">PikWizard</p>
</a>
</span>
</span>
Free (free of charge)
Free for personal and commercial use.
Author: Authentic Images