- Home >
- Stock Photos >
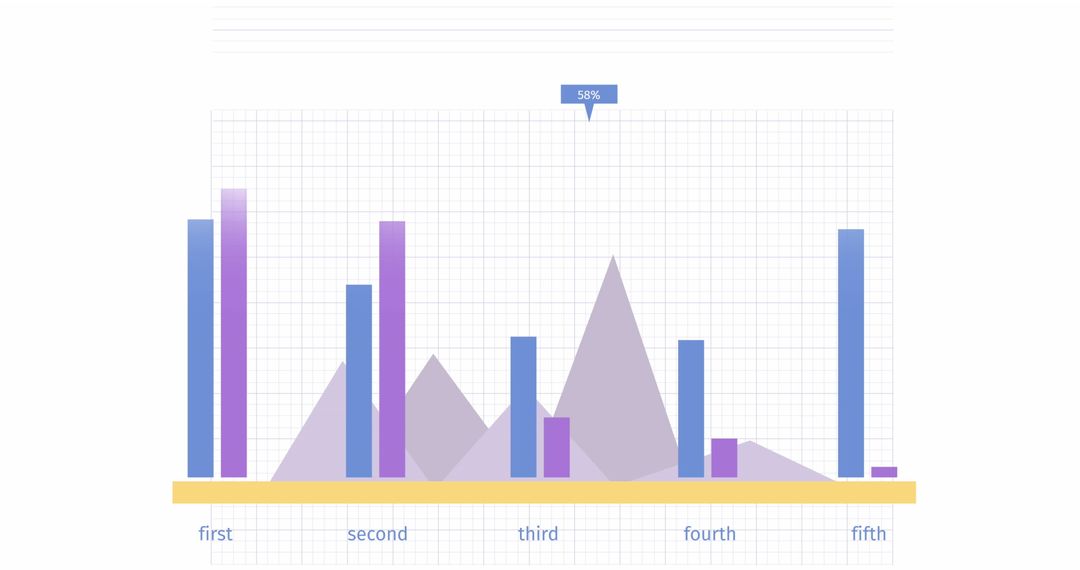
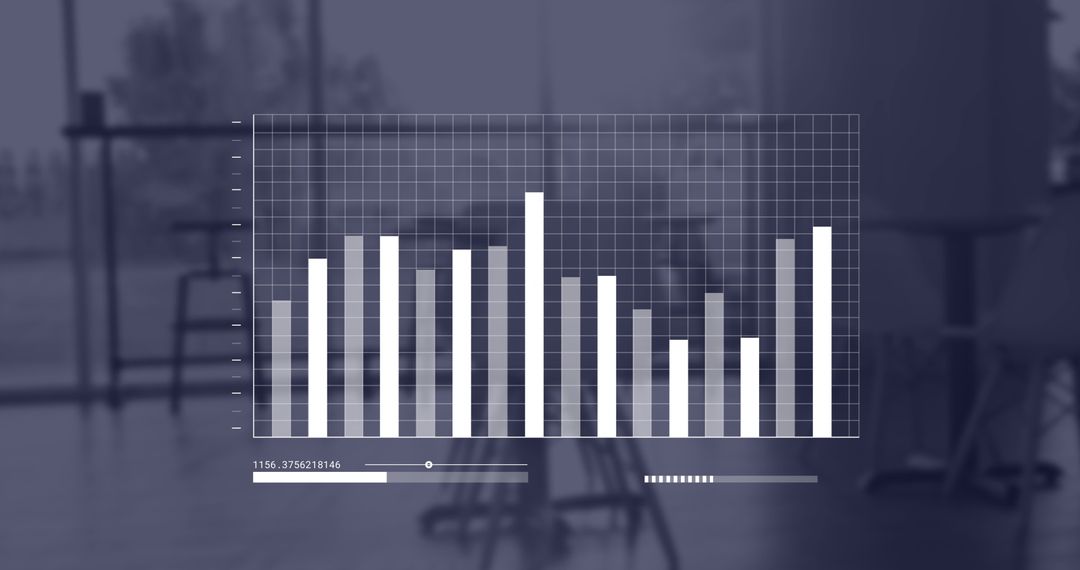
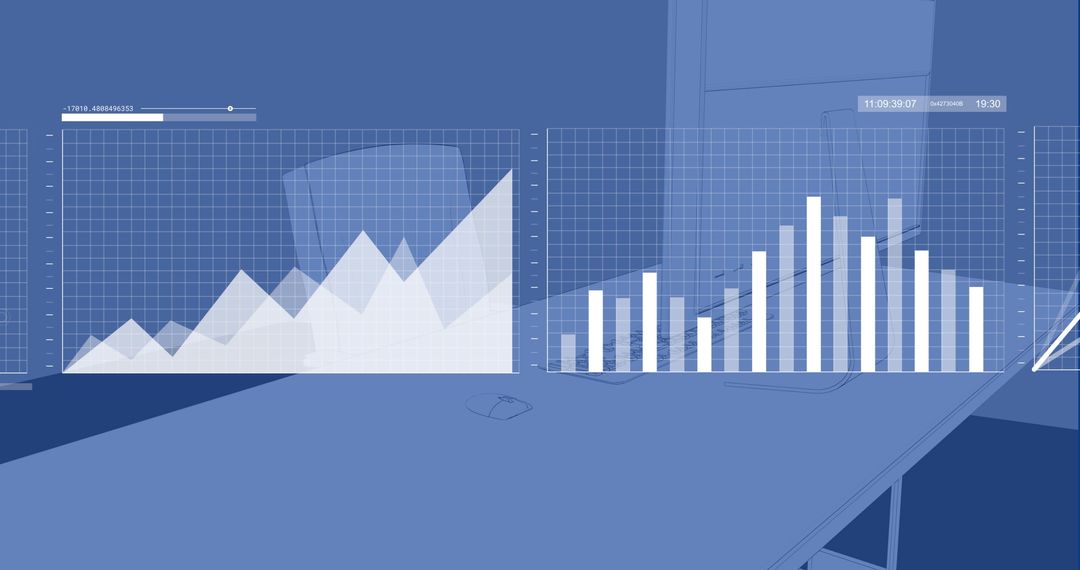
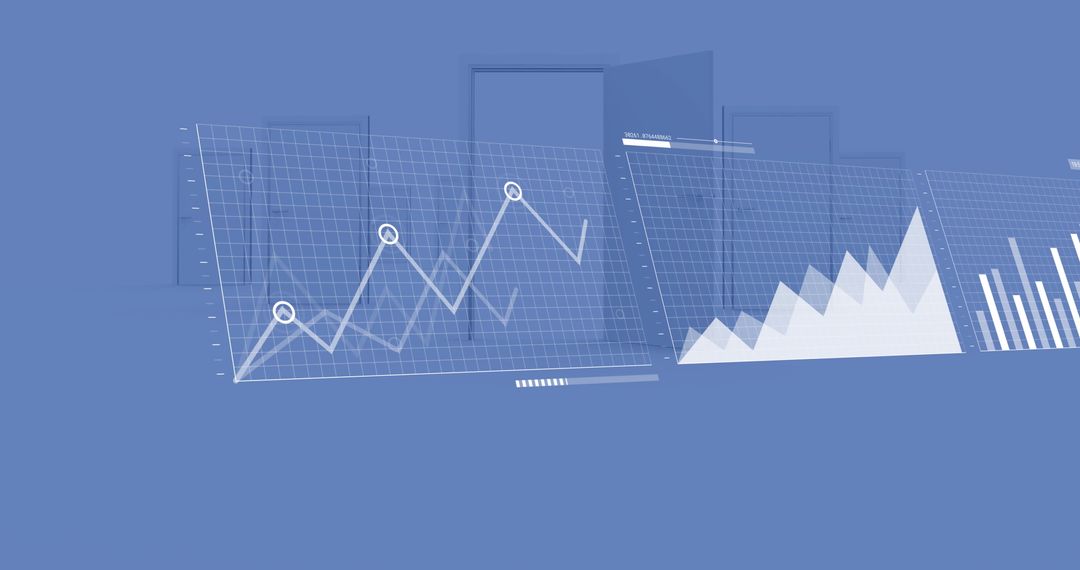
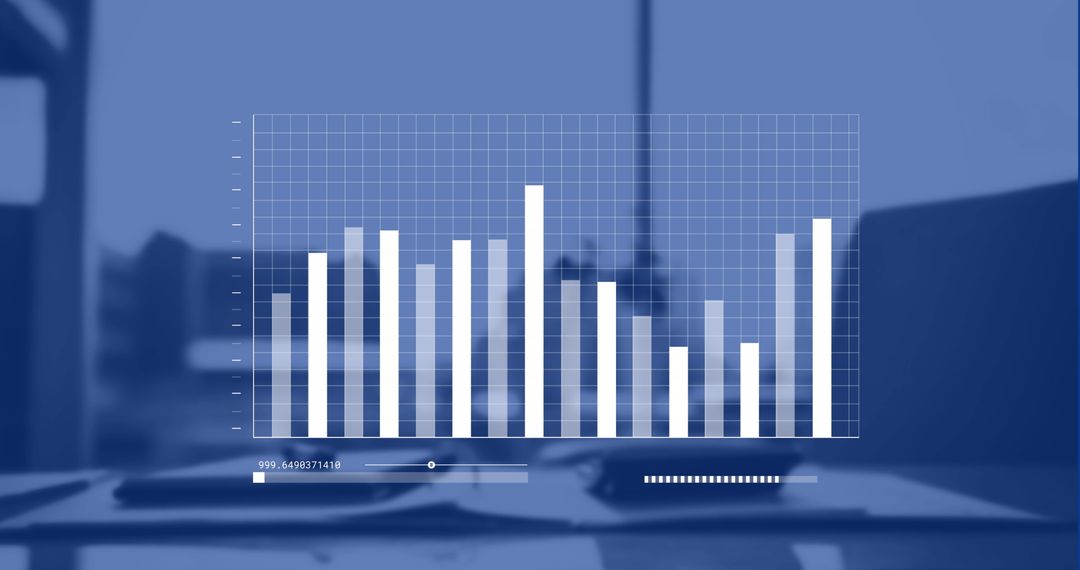
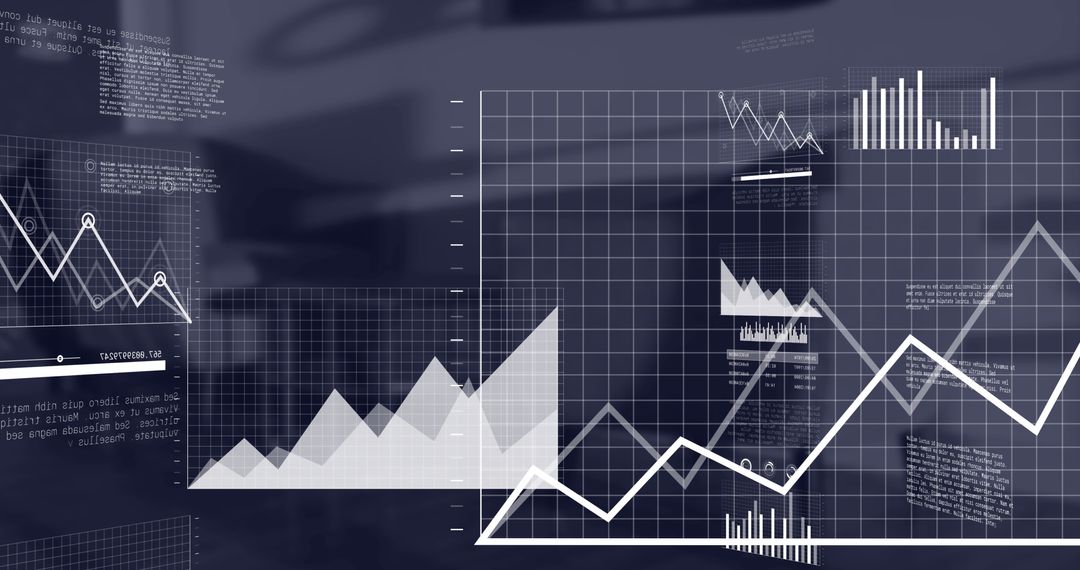
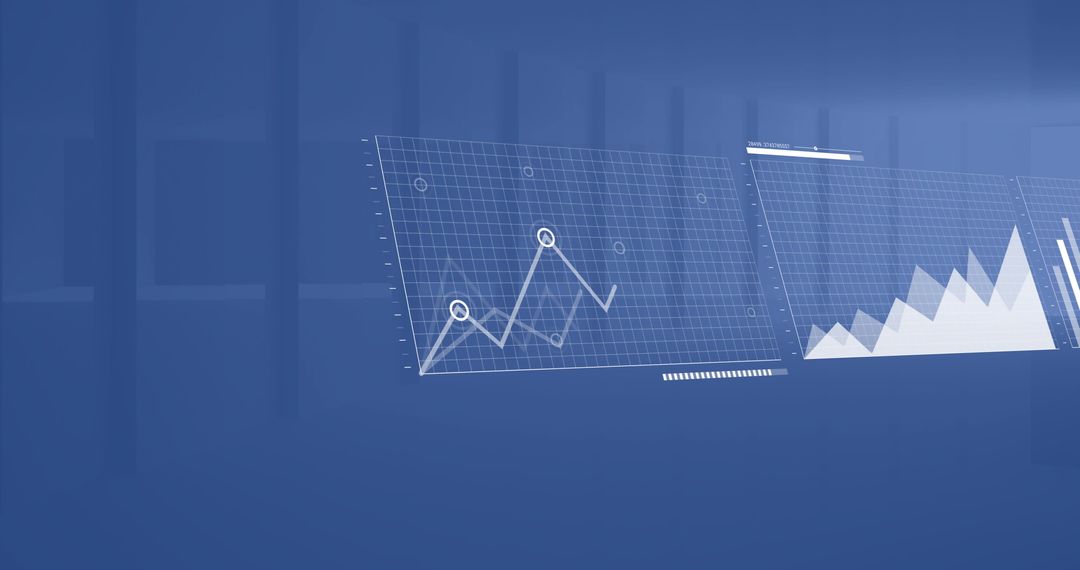
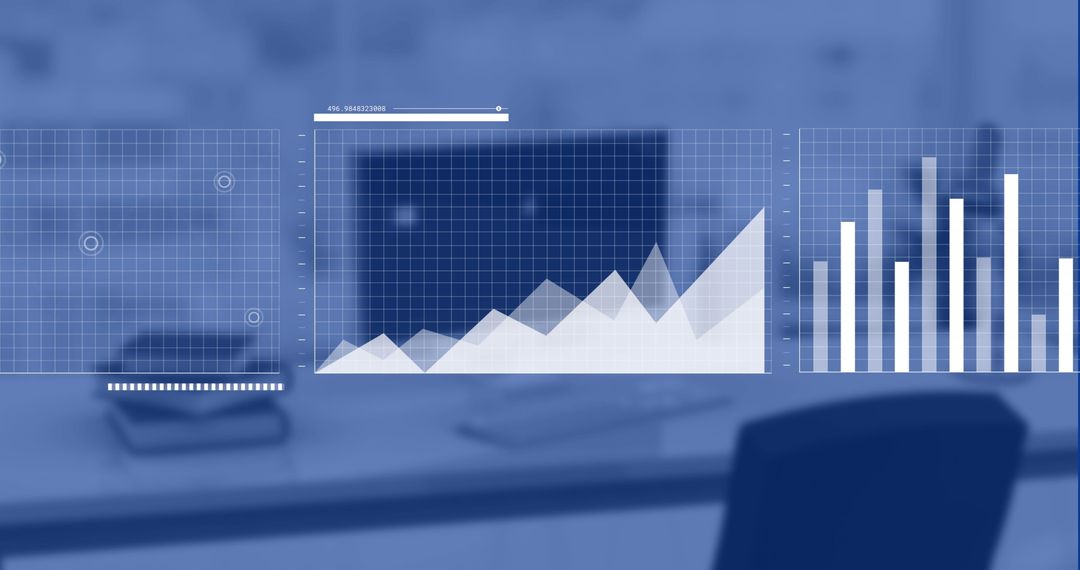
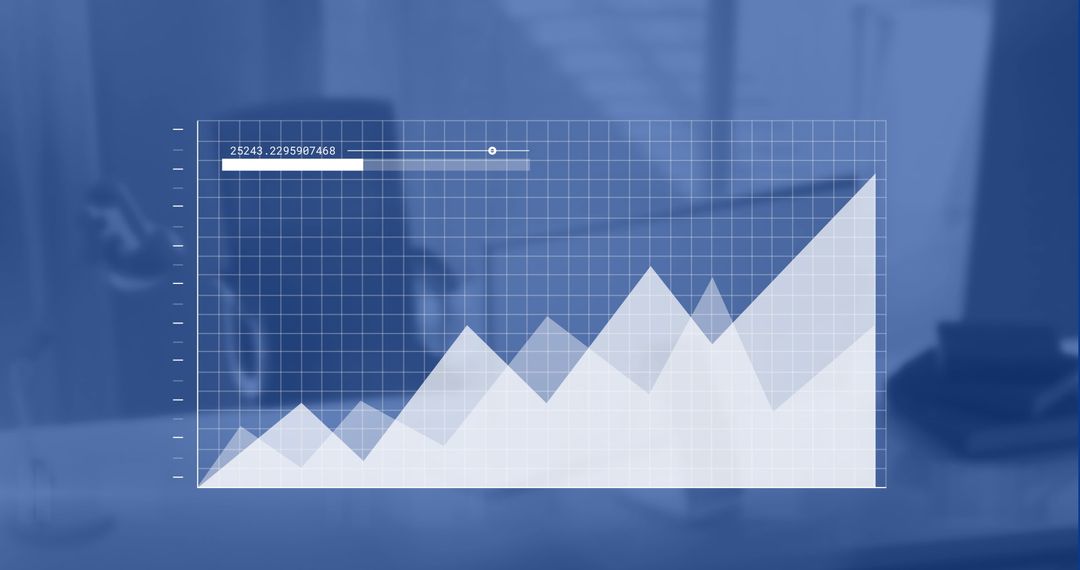
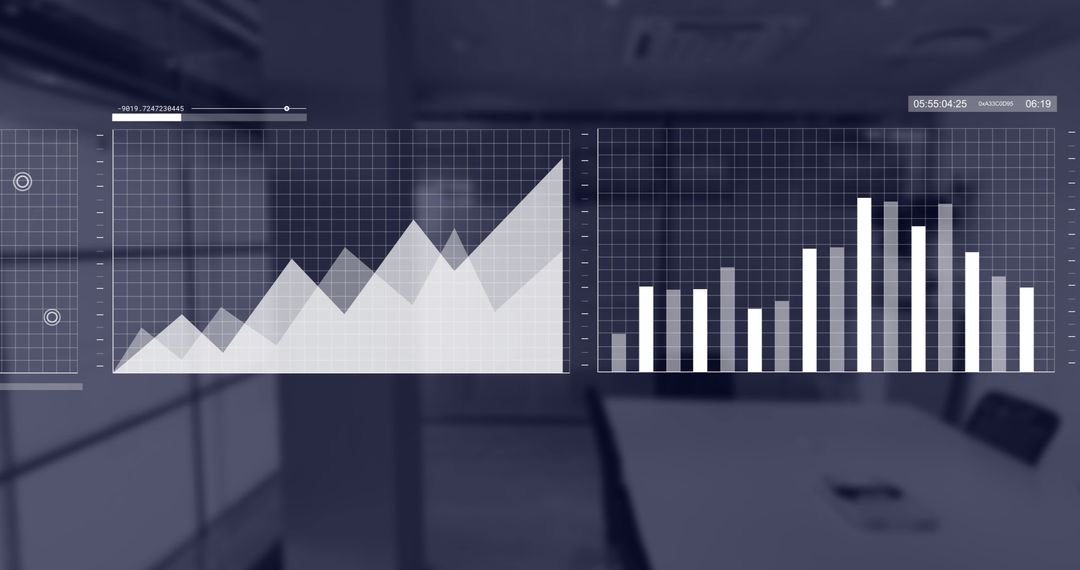
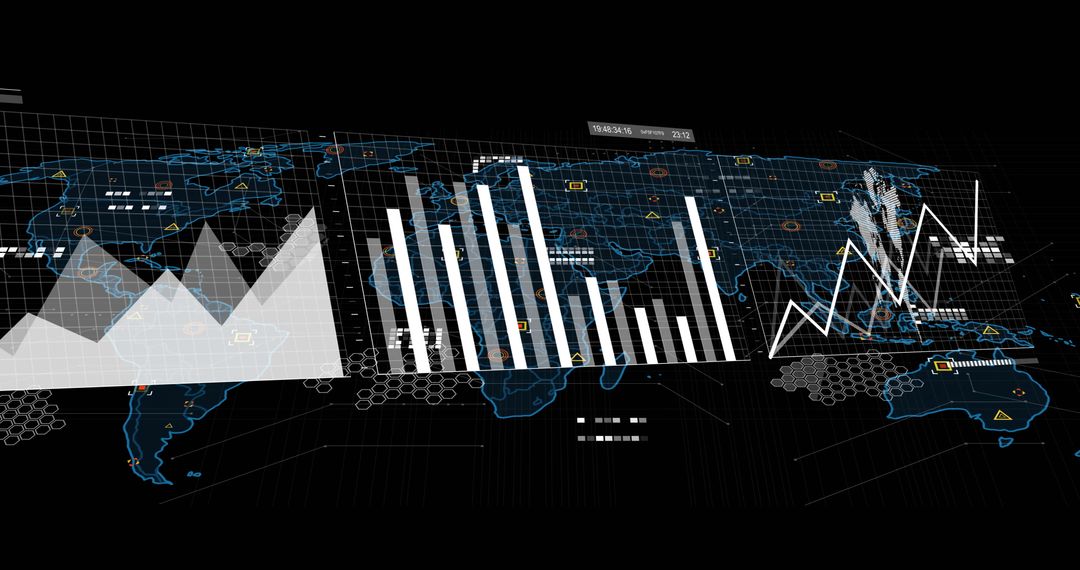
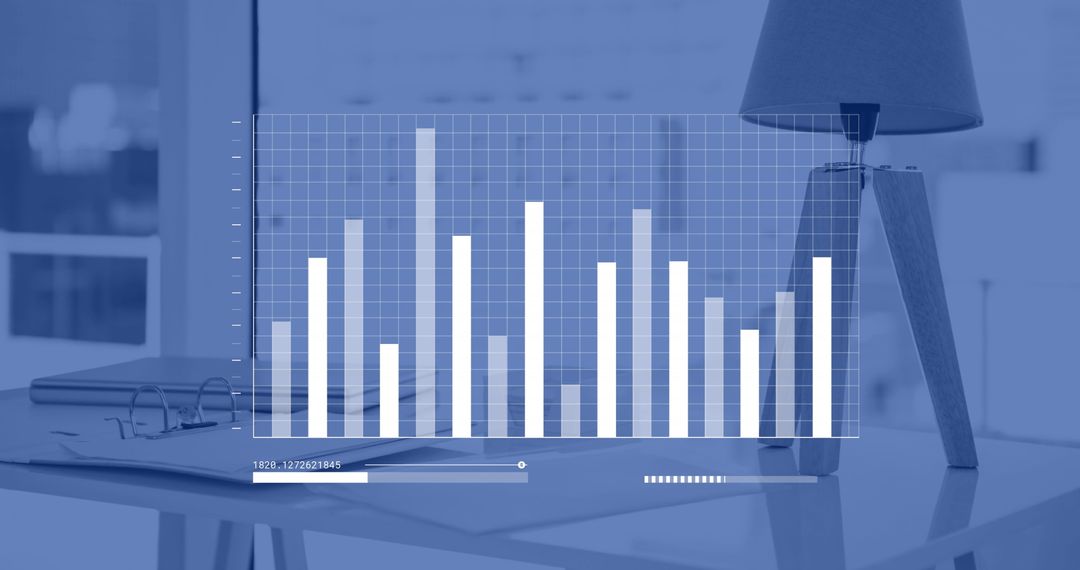
- Digital Data Charts Displayed Over Modern Office Workspace
Digital Data Charts Displayed Over Modern Office Workspace Image

The image showcases computer-generated charts and graphs hovering over an office environment, representing financial data and business analytics. This visual is useful for illustrating global business strategies, financial trends, or technological advancements in corporate settings. Applicable for presentations on data analysis, tech innovation, and business planning.
Powered by 


2
downloads
downloads
Tags:
More
Credit Photo
If you would like to credit the Photo, here are some ways you can do so
Text Link
photo Link
<span class="text-link">
<span>
<a target="_blank" href=https://pikwizard.com/photo/digital-data-charts-displayed-over-modern-office-workspace/55d55d5fe122408b413f3e536ba4e699/>PikWizard</a>
</span>
</span>
<span class="image-link">
<span
style="margin: 0 0 20px 0; display: inline-block; vertical-align: middle; width: 100%;"
>
<a
target="_blank"
href="https://pikwizard.com/photo/digital-data-charts-displayed-over-modern-office-workspace/55d55d5fe122408b413f3e536ba4e699/"
style="text-decoration: none; font-size: 10px; margin: 0;"
>
<img src="https://pikwizard.com/pw/medium/55d55d5fe122408b413f3e536ba4e699.jpg" style="margin: 0; width: 100%;" alt="" />
<p style="font-size: 12px; margin: 0;">PikWizard</p>
</a>
</span>
</span>
Free (free of charge)
Free for personal and commercial use.
Author: Awesome Content
Similar Free Stock Images

Premium


Premium


Premium


Premium


Premium


Premium


Premium


Premium


Premium


Premium


Premium


Premium


Premium


Premium


Premium


Premium

Premium


Premium


Premium


Premium


Premium


Premium


Premium


Premium