
- Home >
- Stock Photos >
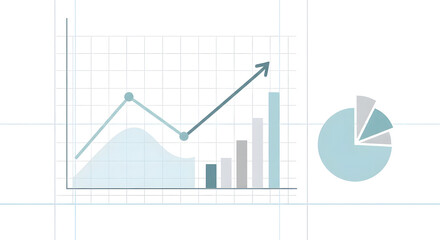
- Digital Data Dashboard with Graphs
Digital Data Dashboard with Graphs Image

This visually engaging design combines various forms of data presentation, including line graphs, bar diagrams, and pie charts. Transparent overlays and numeric labels add depth, while bright lines provide an energetic and modern touch. Use for financial presentations, business intelligence reporting, or tech company media. Ideal for conveying analytical and statistical information in a sleek, digital way.
Powered by 


downloads
Tags:
More
Credit Photo
If you would like to credit the Photo, here are some ways you can do so
Text Link
photo Link
<span class="text-link">
<span>
<a target="_blank" href=https://pikwizard.com/photo/digital-data-dashboard-with-graphs/5ca23d44029a09f86744167336a1b7d4/>PikWizard</a>
</span>
</span>
<span class="image-link">
<span
style="margin: 0 0 20px 0; display: inline-block; vertical-align: middle; width: 100%;"
>
<a
target="_blank"
href="https://pikwizard.com/photo/digital-data-dashboard-with-graphs/5ca23d44029a09f86744167336a1b7d4/"
style="text-decoration: none; font-size: 10px; margin: 0;"
>
<img src="https://pikwizard.com/pw/medium/5ca23d44029a09f86744167336a1b7d4.jpg" style="margin: 0; width: 100%;" alt="" />
<p style="font-size: 12px; margin: 0;">PikWizard</p>
</a>
</span>
</span>
Free (free of charge)
Free for personal and commercial use.
Author: Awesome Content
Similar Free Stock Images

Premium


Premium


Premium


Premium


Premium

Premium


Premium


Premium

Premium

Premium


Premium


Premium


Premium


Premium


Premium


Premium

Premium


Premium


Premium


Premium
Premium

Premium


Premium

Premium


Premium

Explore More Free Stock Images