
- Home >
- Stock Photos >
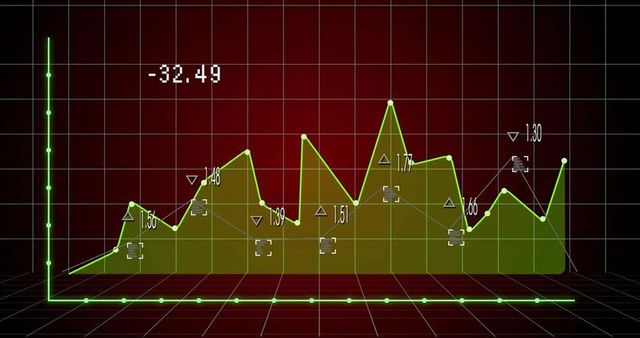
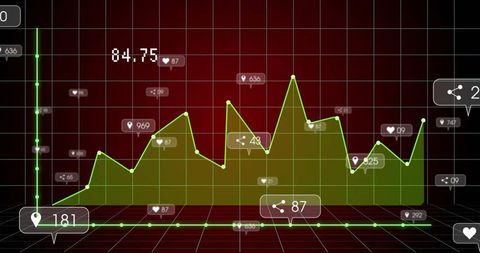
- Digital Data Dashboard with Interactive Area Charts
Digital Data Dashboard with Interactive Area Charts Image

This image displays a modern digital data dashboard exemplifying analytical data through interactive area charts on a dynamic teal axis system. The addition of a numeric marker with a progress bar enhances functionality for presentations or reports. Ideal for illustrating data trends, visual analytics, business presentations, digital marketing strategies, or tech-based design brochures. Great for use in promoting data handling software, financial analysis tools, or tech-product descriptions highlighting data-oriented features.
Powered by  - Get 15% off with code: PIKWIZARD15


downloads
Tags:
More
Credit Photo
If you would like to credit the Photo, here are some ways you can do so
Text Link
photo Link
<span class="text-link">
<span>
<a target="_blank" href=https://pikwizard.com/photo/digital-data-dashboard-with-interactive-area-charts/9c1780de8b72dfd4b6f060cb5fc2b498/>PikWizard</a>
</span>
</span>
<span class="image-link">
<span
style="margin: 0 0 20px 0; display: inline-block; vertical-align: middle; width: 100%;"
>
<a
target="_blank"
href="https://pikwizard.com/photo/digital-data-dashboard-with-interactive-area-charts/9c1780de8b72dfd4b6f060cb5fc2b498/"
style="text-decoration: none; font-size: 10px; margin: 0;"
>
<img src="https://pikwizard.com/pw/medium/9c1780de8b72dfd4b6f060cb5fc2b498.jpg" style="margin: 0; width: 100%;" alt="" />
<p style="font-size: 12px; margin: 0;">PikWizard</p>
</a>
</span>
</span>
Free (free of charge)
Free for personal and commercial use.
Author: Awesome Content
Similar Free Stock Images

Premium


Premium


Premium


Premium

Premium


Premium

Premium

Premium


Premium

Premium

Premium


Premium

Premium


Premium


Premium


Premium


Premium

Premium


Premium


AI


Premium

Premium


Premium


Premium

AI


Premium


Premium


Explore More Free Stock Images