
- Home >
- Stock Photos >
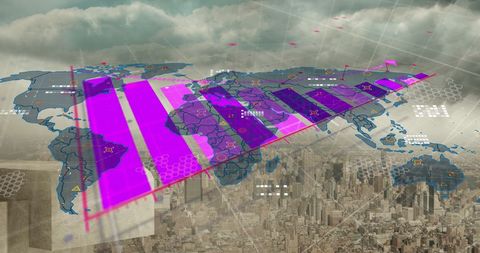
- Digital Data Descending Chart with Thunderstorm Background
Digital Data Descending Chart with Thunderstorm Background Image

Digital chart represented in bar form with a dramatic backdrop of thunderclouds and intersecting grid lines. Lightning and storm clouds suggest turmoil or uncertainty in business data analysis and technology landscapes. Ideal for illustrating risky investments, data volatility, or technology uncertainty concepts. Suitable for articles on economics, business strategies, or data analytics innovation under challenging conditions.
Powered by  - Get 15% off with code: PIKWIZARD15


downloads
Tags:
More
Credit Photo
If you would like to credit the Photo, here are some ways you can do so
Text Link
photo Link
<span class="text-link">
<span>
<a target="_blank" href=https://pikwizard.com/photo/digital-data-descending-chart-with-thunderstorm-background/ba7dd2838f168eb7b8f9ac1d6264093d/>PikWizard</a>
</span>
</span>
<span class="image-link">
<span
style="margin: 0 0 20px 0; display: inline-block; vertical-align: middle; width: 100%;"
>
<a
target="_blank"
href="https://pikwizard.com/photo/digital-data-descending-chart-with-thunderstorm-background/ba7dd2838f168eb7b8f9ac1d6264093d/"
style="text-decoration: none; font-size: 10px; margin: 0;"
>
<img src="https://pikwizard.com/pw/medium/ba7dd2838f168eb7b8f9ac1d6264093d.jpg" style="margin: 0; width: 100%;" alt="" />
<p style="font-size: 12px; margin: 0;">PikWizard</p>
</a>
</span>
</span>
Free (free of charge)
Free for personal and commercial use.
Author: Authentic Images
Similar Free Stock Images

Premium


Premium


Premium


Premium


Premium


Premium


Premium


Premium


Premium


Premium

Premium

Premium


Premium


Premium

Premium


Premium

Premium


Premium


Premium

Premium


Premium


Premium

Premium

Premium

Premium


Explore More Free Stock Images