
- Home >
- Stock Photos >
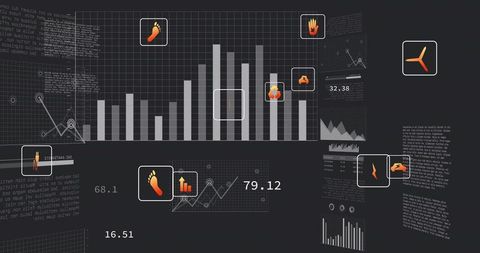
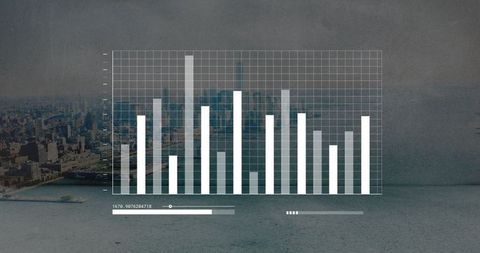
- Digital Data Display with Charts in Virtual Office Space
Digital Data Display with Charts in Virtual Office Space Image

Visual shows digital charts and graphs appearing in office environment, signifying data analysis and technology integration. Useful for topics like corporate analysis, business intelligence, data processing, and technology innovation.
Powered by 


downloads
Tags:
More
Credit Photo
If you would like to credit the Photo, here are some ways you can do so
Text Link
photo Link
<span class="text-link">
<span>
<a target="_blank" href=https://pikwizard.com/photo/digital-data-display-with-charts-in-virtual-office-space/fd1ea33ff02c44b6a2e3917c2a2e8de9/>PikWizard</a>
</span>
</span>
<span class="image-link">
<span
style="margin: 0 0 20px 0; display: inline-block; vertical-align: middle; width: 100%;"
>
<a
target="_blank"
href="https://pikwizard.com/photo/digital-data-display-with-charts-in-virtual-office-space/fd1ea33ff02c44b6a2e3917c2a2e8de9/"
style="text-decoration: none; font-size: 10px; margin: 0;"
>
<img src="https://pikwizard.com/pw/medium/fd1ea33ff02c44b6a2e3917c2a2e8de9.jpg" style="margin: 0; width: 100%;" alt="" />
<p style="font-size: 12px; margin: 0;">PikWizard</p>
</a>
</span>
</span>
Free (free of charge)
Free for personal and commercial use.
Author: Creative Art
Similar Free Stock Images

Premium


Premium


Premium

Premium


Premium


Premium


Premium


Premium

Premium


Premium

Premium


Premium


Premium

Premium

Premium


Premium


Premium


Premium


Premium


Premium

Premium


Premium


Premium

Premium

Premium


Explore More Free Stock Images