
- Home >
- Stock Photos >
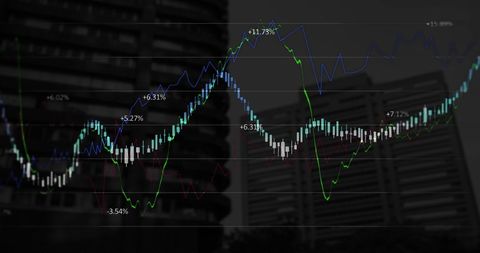
- Digital Data Flow Over Financial Cityscape
Digital Data Flow Over Financial Cityscape Image

This visual shows intertwined digital and business elements with financial data overlay on a city night skyline. Ideal for concepts related to financial technology, investment trends, and smart cities. Perfect for business reports, presentations on economic growth, or technology blogs.
Powered by  - Get 15% off with code: PIKWIZARD15


2
downloads
downloads
Tags:
More
Credit Photo
If you would like to credit the Photo, here are some ways you can do so
Text Link
photo Link
<span class="text-link">
<span>
<a target="_blank" href=https://pikwizard.com/photo/digital-data-flow-over-financial-cityscape/13c083706c9e3eff90321c4a2c7f818c/>PikWizard</a>
</span>
</span>
<span class="image-link">
<span
style="margin: 0 0 20px 0; display: inline-block; vertical-align: middle; width: 100%;"
>
<a
target="_blank"
href="https://pikwizard.com/photo/digital-data-flow-over-financial-cityscape/13c083706c9e3eff90321c4a2c7f818c/"
style="text-decoration: none; font-size: 10px; margin: 0;"
>
<img src="https://pikwizard.com/pw/medium/13c083706c9e3eff90321c4a2c7f818c.jpg" style="margin: 0; width: 100%;" alt="" />
<p style="font-size: 12px; margin: 0;">PikWizard</p>
</a>
</span>
</span>
Free (free of charge)
Free for personal and commercial use.
Author: Awesome Content
Similar Free Stock Images
Loading...

Premium


Premium

Premium


Premium


Premium

Premium


Premium


Premium


Premium


Premium


Premium


Premium

Premium


Premium

Premium
Premium


Premium


Premium


Premium


Premium


Premium


Premium

Premium

Premium


Premium
