- Home >
- Stock Photos >
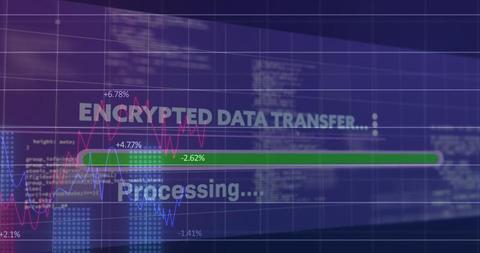
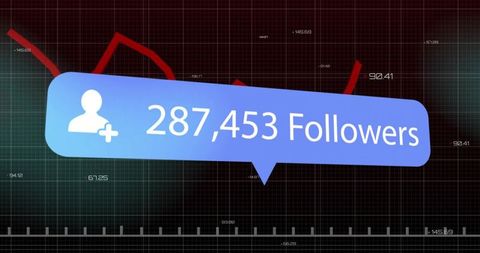
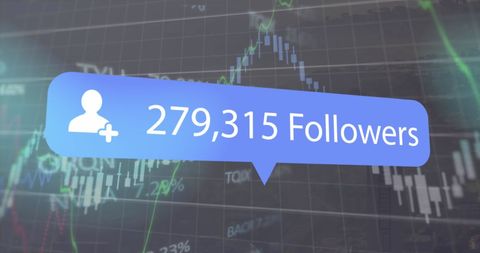
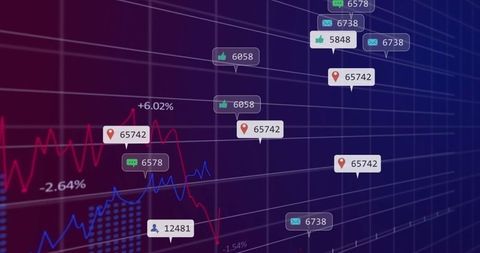
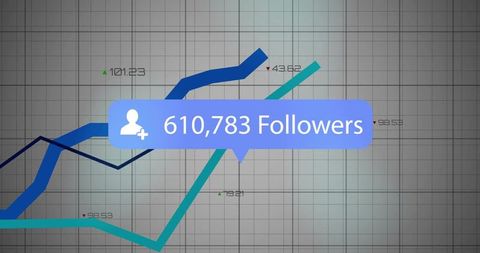
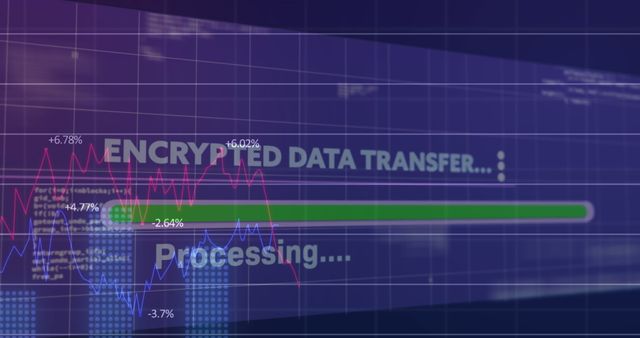
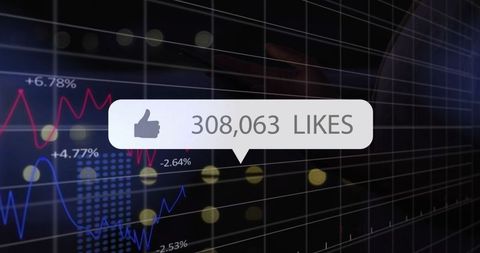
- Digital Data Integration and Social Media Metrics Visualized
Digital Data Integration and Social Media Metrics Visualized Image

Visual representation integrating financial data with social media metrics shows impact of internet trends on business forecasting. Useful for digital marketing presentations, financial analytics material, illustrating tech influence on financial markets.
Powered by 


2
downloads
downloads
Tags:
More
Credit Photo
If you would like to credit the Photo, here are some ways you can do so
Text Link
photo Link
<span class="text-link">
<span>
<a target="_blank" href=https://pikwizard.com/photo/digital-data-integration-and-social-media-metrics-visualized/e06fc01661153b214539fe9a72de3936/>PikWizard</a>
</span>
</span>
<span class="image-link">
<span
style="margin: 0 0 20px 0; display: inline-block; vertical-align: middle; width: 100%;"
>
<a
target="_blank"
href="https://pikwizard.com/photo/digital-data-integration-and-social-media-metrics-visualized/e06fc01661153b214539fe9a72de3936/"
style="text-decoration: none; font-size: 10px; margin: 0;"
>
<img src="https://pikwizard.com/pw/medium/e06fc01661153b214539fe9a72de3936.jpg" style="margin: 0; width: 100%;" alt="" />
<p style="font-size: 12px; margin: 0;">PikWizard</p>
</a>
</span>
</span>
Free (free of charge)
Free for personal and commercial use.
Author: People Creations
Similar Free Stock Images

Premium


Premium


Premium


Premium


Premium


Premium


Premium


Premium


Premium


Premium


Premium


Premium


Premium


Premium


Premium


Premium


Premium


Premium


Premium


Premium


Premium


Premium


Premium


Premium


Premium