- Home >
- Stock Photos >
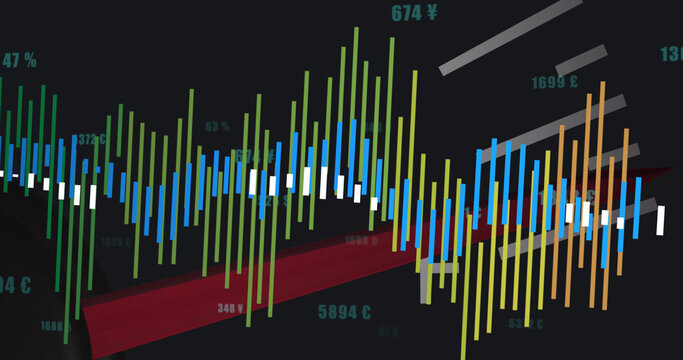
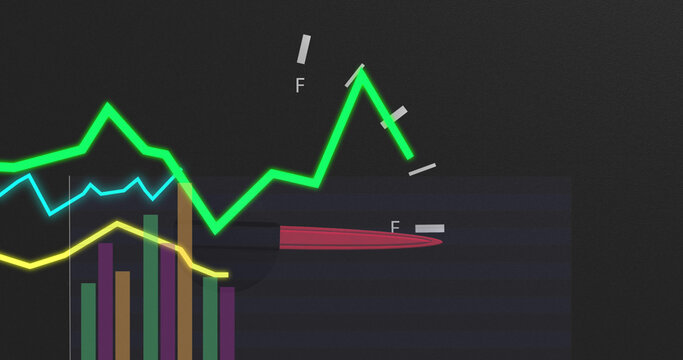
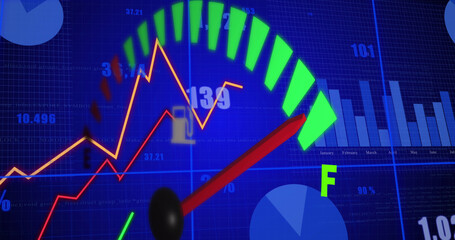
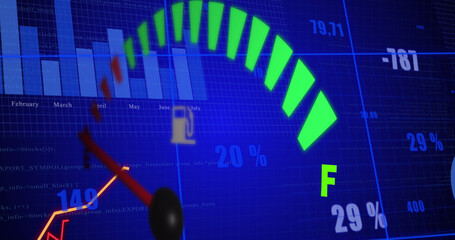
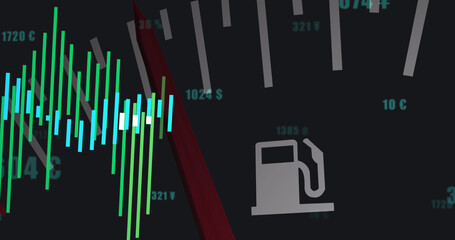
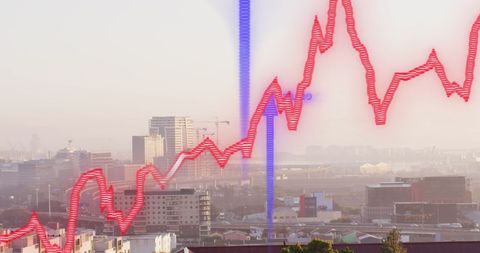
- Digital Data Interface on Car Panel with Financial Trends
Digital Data Interface on Car Panel with Financial Trends Image

Stylized depiction of data processing over car panel, featuring dynamic lines that represent various financial trends. This creative and modern illustration alludes to the connection between automotive technology and digital data analytics. It can be used for content related to business strategy, automotive innovation, and digital financial growth.
Powered by 

2
downloads
downloads
Tags:
More
Credit Photo
If you would like to credit the Photo, here are some ways you can do so
Text Link
photo Link
<span class="text-link">
<span>
<a target="_blank" href=https://pikwizard.com/photo/digital-data-interface-on-car-panel-with-financial-trends/d46f868d5412fa14cad0752401c2a018/>PikWizard</a>
</span>
</span>
<span class="image-link">
<span
style="margin: 0 0 20px 0; display: inline-block; vertical-align: middle; width: 100%;"
>
<a
target="_blank"
href="https://pikwizard.com/photo/digital-data-interface-on-car-panel-with-financial-trends/d46f868d5412fa14cad0752401c2a018/"
style="text-decoration: none; font-size: 10px; margin: 0;"
>
<img src="https://pikwizard.com/pw/medium/d46f868d5412fa14cad0752401c2a018.jpg" style="margin: 0; width: 100%;" alt="" />
<p style="font-size: 12px; margin: 0;">PikWizard</p>
</a>
</span>
</span>
Free (free of charge)
Free for personal and commercial use.
Author: People Creations
Similar Free Stock Images
Loading...

Premium


Premium
Premium


Premium


Premium
Premium

Premium


Premium


Premium