
- Home >
- Stock Photos >
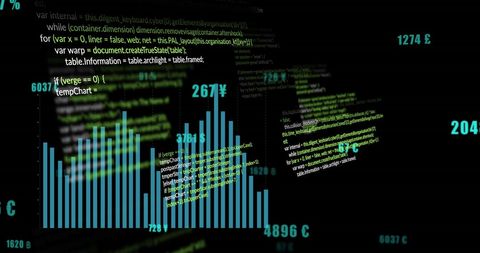
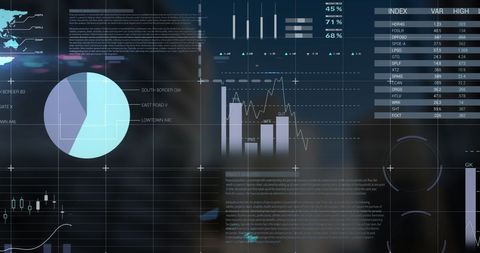
- Digital Data Interface with Graphs for Business Analysis
Digital Data Interface with Graphs for Business Analysis Image

Featuring complex graphs and data overlays, this design embodies high-tech business analysis and digital transformation themes. Ideal for illustrating concepts related to financial reports, business growth, technology advancements, or data visualization in presentations or articles. The futuristic look aligns well with narratives on innovation and global business trends.
Powered by 


downloads
Tags:
More
Credit Photo
If you would like to credit the Photo, here are some ways you can do so
Text Link
photo Link
<span class="text-link">
<span>
<a target="_blank" href=https://pikwizard.com/photo/digital-data-interface-with-graphs-for-business-analysis/27205f62eef3783bd180c5cf5d965c66/>PikWizard</a>
</span>
</span>
<span class="image-link">
<span
style="margin: 0 0 20px 0; display: inline-block; vertical-align: middle; width: 100%;"
>
<a
target="_blank"
href="https://pikwizard.com/photo/digital-data-interface-with-graphs-for-business-analysis/27205f62eef3783bd180c5cf5d965c66/"
style="text-decoration: none; font-size: 10px; margin: 0;"
>
<img src="https://pikwizard.com/pw/medium/27205f62eef3783bd180c5cf5d965c66.jpg" style="margin: 0; width: 100%;" alt="" />
<p style="font-size: 12px; margin: 0;">PikWizard</p>
</a>
</span>
</span>
Free (free of charge)
Free for personal and commercial use.
Author: Creative Art
Similar Free Stock Images

Premium


Premium


Premium


Premium


Premium


Premium


Premium


Premium


Premium


Premium

Premium

Premium


Premium


Premium


Premium


Premium


Premium


Premium


Premium


Premium


Premium


Premium


Premium


Premium

Premium


Explore More Free Stock Images