- Home >
- Stock Photos >
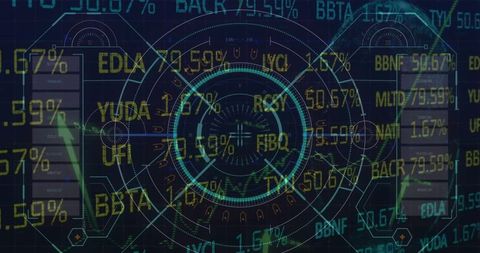
- Digital Data Interface with Radar and Graphs for Business Analytics
Digital Data Interface with Radar and Graphs for Business Analytics Image
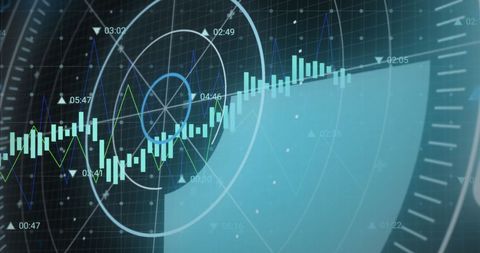
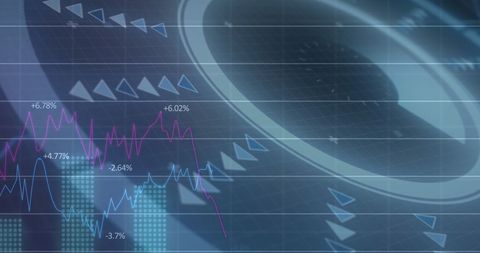
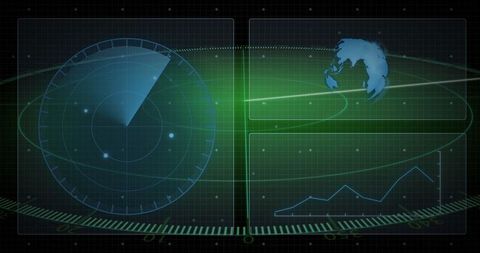
This visually engaging visual illustrates abstractions of an advanced digital interface, designed for business analytics. Overlay of radar elements and fluctuating graphs signifies complex data processing and tracking used in various financial and business contexts. Ideal for use in presentations on financial technologies, business strategy analysis, or educational materials exploring digital data handling methods.

downloads
Tags:
More
Credit Photo
If you would like to credit the Photo, here are some ways you can do so
Text Link
photo Link
<span class="text-link">
<span>
<a target="_blank" href=https://pikwizard.com/photo/digital-data-interface-with-radar-and-graphs-for-business-analytics/a8276d49ec92c05afe14d1b3d6ea2ebe/>PikWizard</a>
</span>
</span>
<span class="image-link">
<span
style="margin: 0 0 20px 0; display: inline-block; vertical-align: middle; width: 100%;"
>
<a
target="_blank"
href="https://pikwizard.com/photo/digital-data-interface-with-radar-and-graphs-for-business-analytics/a8276d49ec92c05afe14d1b3d6ea2ebe/"
style="text-decoration: none; font-size: 10px; margin: 0;"
>
<img src="https://pikwizard.com/pw/medium/a8276d49ec92c05afe14d1b3d6ea2ebe.jpg" style="margin: 0; width: 100%;" alt="" />
<p style="font-size: 12px; margin: 0;">PikWizard</p>
</a>
</span>
</span>
Free (free of charge)
Free for personal and commercial use.
Author: Awesome Content