
- Home >
- Stock Photos >
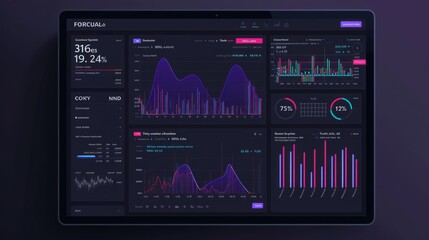
- Digital Data Interface with Statistical Analysis and Charts
Digital Data Interface with Statistical Analysis and Charts Image

Interface showing statistical data and charts layered over a digital display suitable for presentations or articles on data analytics. Its futuristic aesthetic makes it perfect for content related to data science, business intelligence, or digital innovation.
Powered by 


downloads
Tags:
More
Credit Photo
If you would like to credit the Photo, here are some ways you can do so
Text Link
photo Link
<span class="text-link">
<span>
<a target="_blank" href=https://pikwizard.com/photo/digital-data-interface-with-statistical-analysis-and-charts/9d37e7538f734e0a16d9f8a54c08f2fb/>PikWizard</a>
</span>
</span>
<span class="image-link">
<span
style="margin: 0 0 20px 0; display: inline-block; vertical-align: middle; width: 100%;"
>
<a
target="_blank"
href="https://pikwizard.com/photo/digital-data-interface-with-statistical-analysis-and-charts/9d37e7538f734e0a16d9f8a54c08f2fb/"
style="text-decoration: none; font-size: 10px; margin: 0;"
>
<img src="https://pikwizard.com/pw/medium/9d37e7538f734e0a16d9f8a54c08f2fb.jpg" style="margin: 0; width: 100%;" alt="" />
<p style="font-size: 12px; margin: 0;">PikWizard</p>
</a>
</span>
</span>
Free (free of charge)
Free for personal and commercial use.
Author: Creative Art
Similar Free Stock Images

Premium


Premium


Premium


Premium


Premium


Premium

Premium


Premium


Premium


Premium


Premium


Premium


Premium

Premium

Premium

Premium


Premium


Premium


Premium

Premium


Premium


Premium


Premium


Premium

Premium


Explore More Free Stock Images