
- Home >
- Stock Photos >
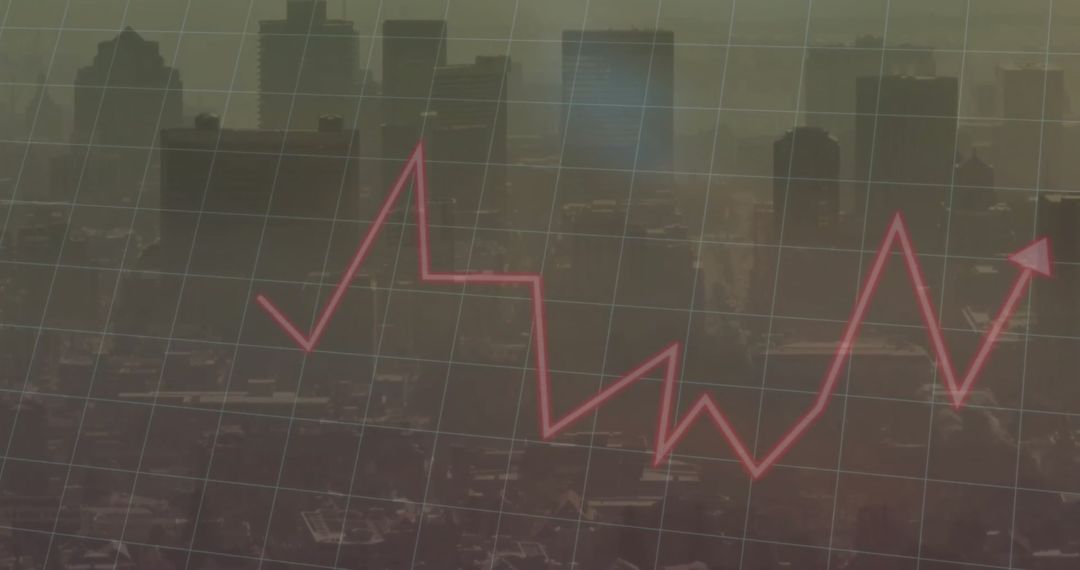
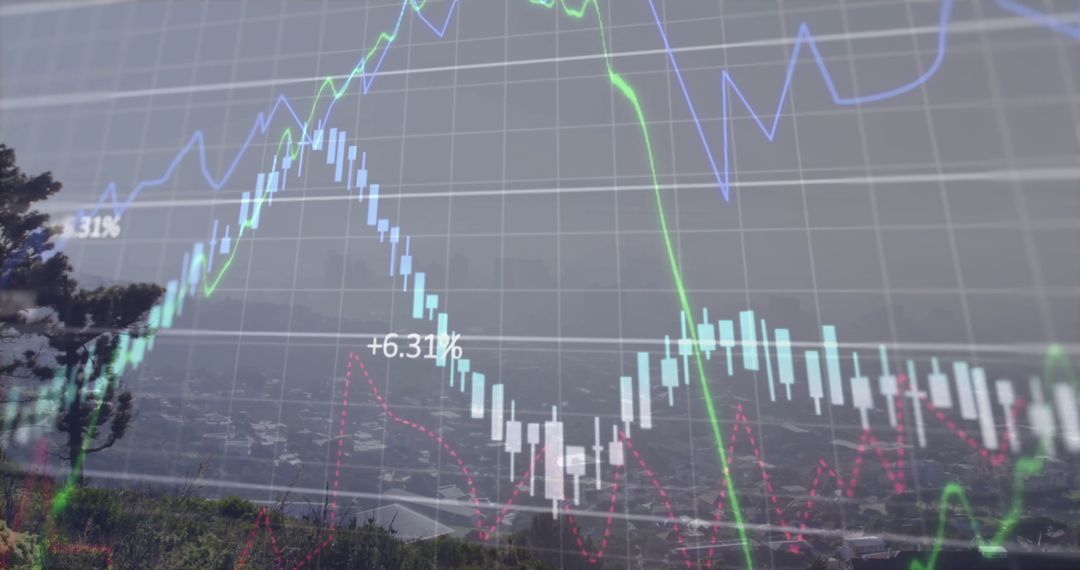
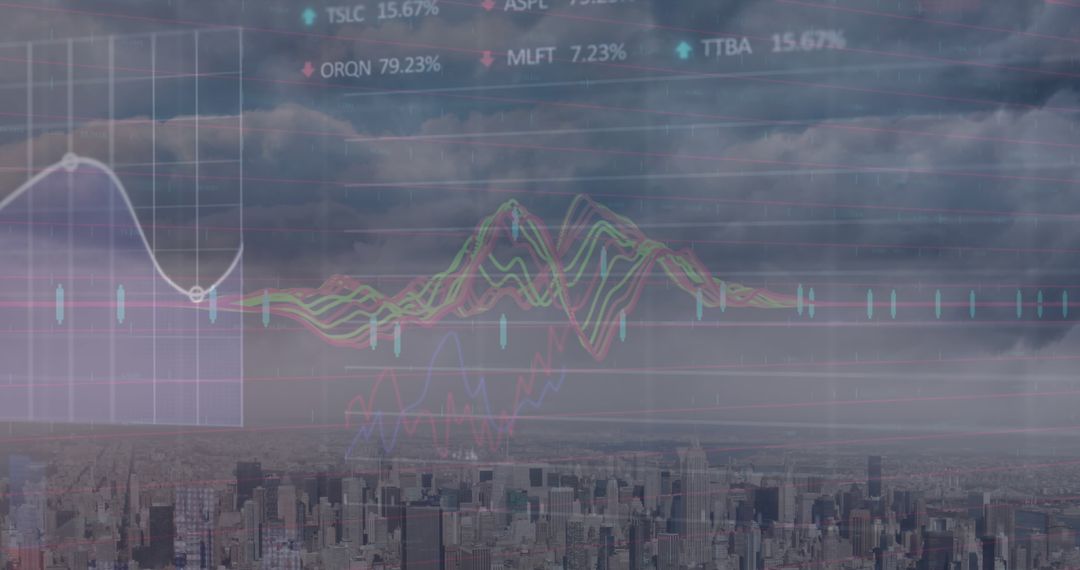
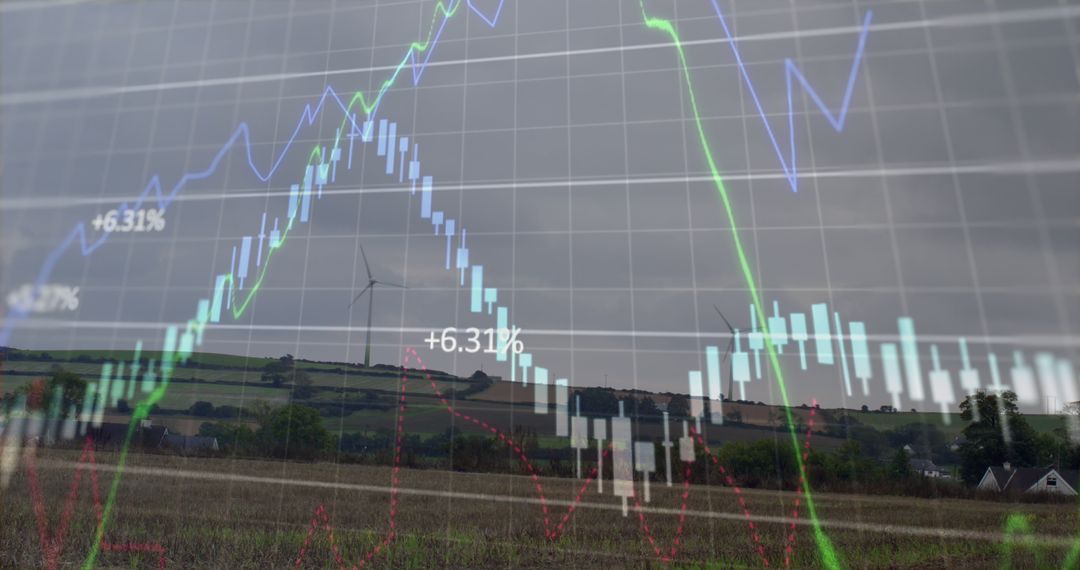
- Digital Data Overlay on Cityscape Reflecting Global Business Trends
Digital Data Overlay on Cityscape Reflecting Global Business Trends Image

Abstract projection of data charts and digital diagrams superimposed on a cityscape represents global business dynamics and interface concepts, useful for illustrating economic growth, digital trends, and finance-related content. Appropriate for presentations on big data, market analytics, and virtual financial environments.
Powered by  - Get 15% off with code: PIKWIZARD15


2
downloads
downloads
Tags:
More
Credit Photo
If you would like to credit the Photo, here are some ways you can do so
Text Link
photo Link
<span class="text-link">
<span>
<a target="_blank" href=https://pikwizard.com/photo/digital-data-overlay-on-cityscape-reflecting-global-business-trends/35040746d0ec0bcb599978be582e521d/>PikWizard</a>
</span>
</span>
<span class="image-link">
<span
style="margin: 0 0 20px 0; display: inline-block; vertical-align: middle; width: 100%;"
>
<a
target="_blank"
href="https://pikwizard.com/photo/digital-data-overlay-on-cityscape-reflecting-global-business-trends/35040746d0ec0bcb599978be582e521d/"
style="text-decoration: none; font-size: 10px; margin: 0;"
>
<img src="https://pikwizard.com/pw/medium/35040746d0ec0bcb599978be582e521d.jpg" style="margin: 0; width: 100%;" alt="" />
<p style="font-size: 12px; margin: 0;">PikWizard</p>
</a>
</span>
</span>
Free (free of charge)
Free for personal and commercial use.
Author: Authentic Images
Similar Free Stock Images

Premium


Premium


Premium


Premium


Premium


Premium


Premium


Premium


Premium


Premium


Premium


Premium


Premium


Premium


Premium


Premium


Premium


Premium


Premium


Premium


Premium


Premium


Premium


Premium

