- Home >
- Stock Photos >
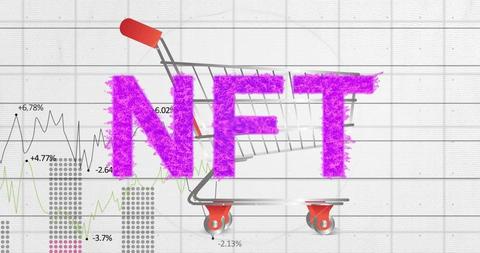
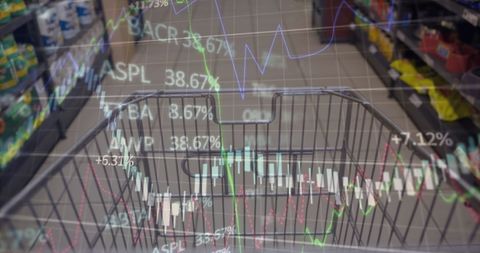
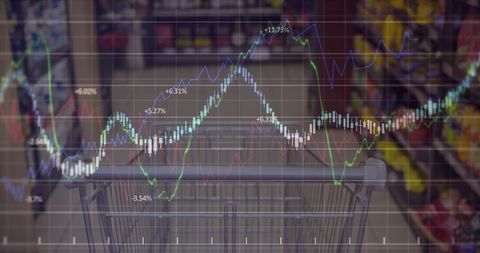
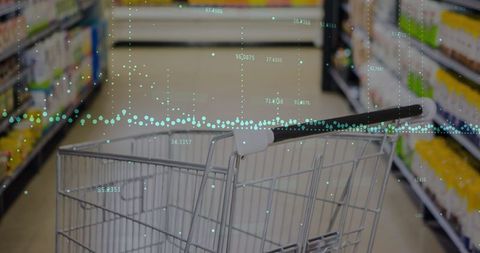
- Digital Data Overlay on Shopping Cart Represents Market Trends
Digital Data Overlay on Shopping Cart Represents Market Trends Image

This image shows digital data graphics overlaid on a shopping cart, symbolizing market trends and digital business insights. It can be used in articles about global commerce, economic reports, technology in retail, and business analytics.
Powered by 


2
downloads
downloads
Tags:
More
Credit Photo
If you would like to credit the Photo, here are some ways you can do so
Text Link
photo Link
<span class="text-link">
<span>
<a target="_blank" href=https://pikwizard.com/photo/digital-data-overlay-on-shopping-cart-represents-market-trends/d6a9972e2d56d4f6d72cb42d1c903a8e/>PikWizard</a>
</span>
</span>
<span class="image-link">
<span
style="margin: 0 0 20px 0; display: inline-block; vertical-align: middle; width: 100%;"
>
<a
target="_blank"
href="https://pikwizard.com/photo/digital-data-overlay-on-shopping-cart-represents-market-trends/d6a9972e2d56d4f6d72cb42d1c903a8e/"
style="text-decoration: none; font-size: 10px; margin: 0;"
>
<img src="https://pikwizard.com/pw/medium/d6a9972e2d56d4f6d72cb42d1c903a8e.jpg" style="margin: 0; width: 100%;" alt="" />
<p style="font-size: 12px; margin: 0;">PikWizard</p>
</a>
</span>
</span>
Free (free of charge)
Free for personal and commercial use.
Author: Authentic Images
Similar Free Stock Images
Loading...

Premium


Premium


Premium

Premium


Premium


Premium


Premium


Premium


Premium

Premium


Premium


Premium

Premium

Premium


Premium

Premium


Premium


Premium

Premium


Premium


Premium


Premium

Premium

Premium


Premium