
- Home >
- Stock Photos >
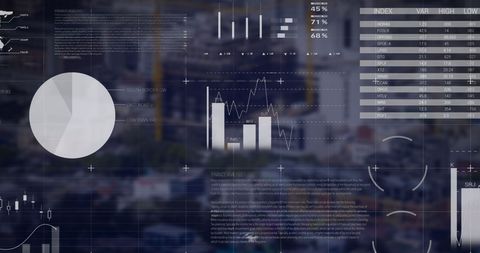
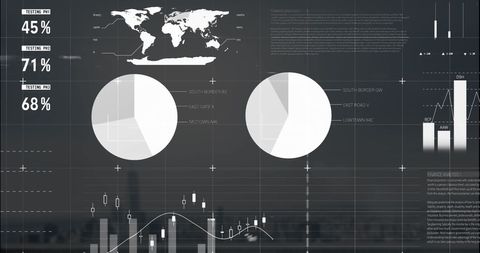
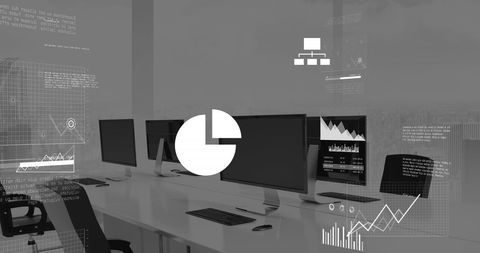
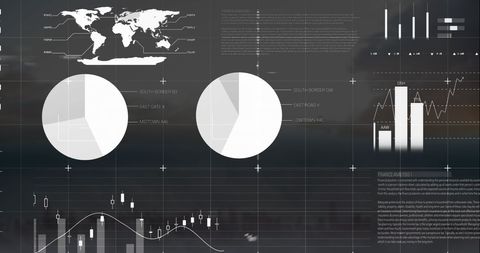
- Digital Data Processing Analytics in Modern Office
Digital Data Processing Analytics in Modern Office Image

Illustration depicts financial data processing in a modern office environment, suggesting connections in technology and analytics. Useful for articles about technology integration, financial analytics, and global business processes.
Powered by 


downloads
Tags:
More
Credit Photo
If you would like to credit the Photo, here are some ways you can do so
Text Link
photo Link
<span class="text-link">
<span>
<a target="_blank" href=https://pikwizard.com/photo/digital-data-processing-analytics-in-modern-office/dd7a82b2cd84052ef3ce59a39132c066/>PikWizard</a>
</span>
</span>
<span class="image-link">
<span
style="margin: 0 0 20px 0; display: inline-block; vertical-align: middle; width: 100%;"
>
<a
target="_blank"
href="https://pikwizard.com/photo/digital-data-processing-analytics-in-modern-office/dd7a82b2cd84052ef3ce59a39132c066/"
style="text-decoration: none; font-size: 10px; margin: 0;"
>
<img src="https://pikwizard.com/pw/medium/dd7a82b2cd84052ef3ce59a39132c066.jpg" style="margin: 0; width: 100%;" alt="" />
<p style="font-size: 12px; margin: 0;">PikWizard</p>
</a>
</span>
</span>
Free (free of charge)
Free for personal and commercial use.
Author: Authentic Images
Similar Free Stock Images

Premium


Premium


Premium


Premium


Premium

Premium


Premium


Premium


Premium


Premium


Premium


Premium

Premium


Premium


Premium


Premium


Premium

Premium


Premium


Premium


Premium


Premium


Premium

Premium

Premium

Explore More Free Stock Images