- Home >
- Stock Photos >
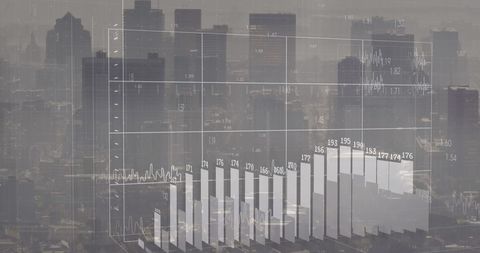
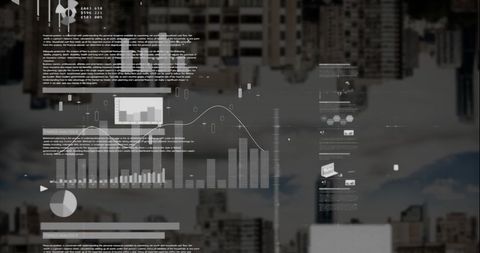
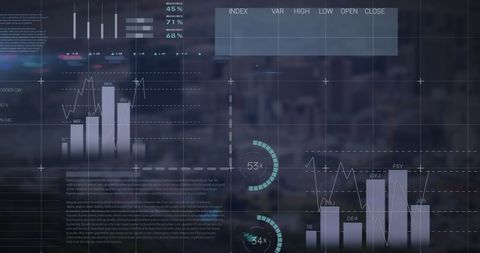
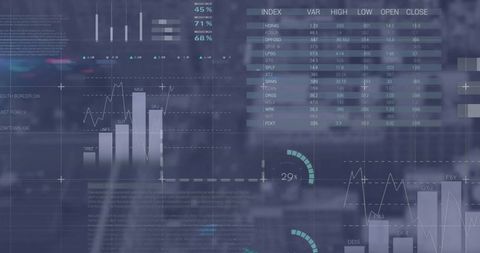
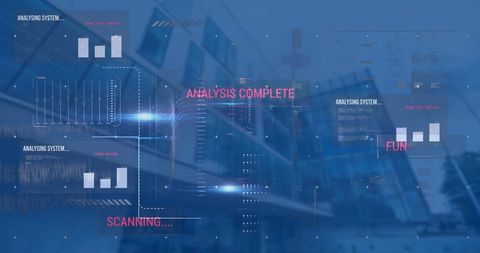
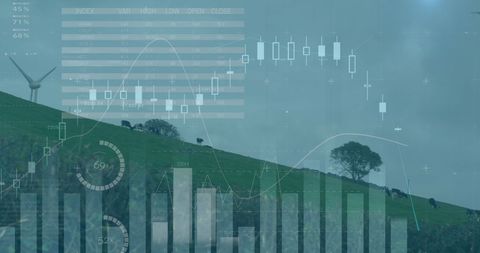
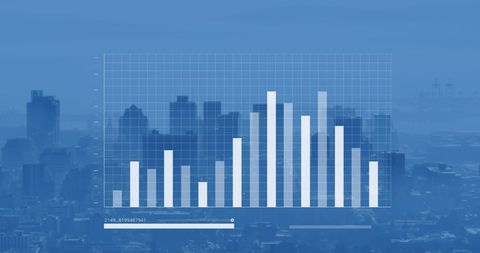
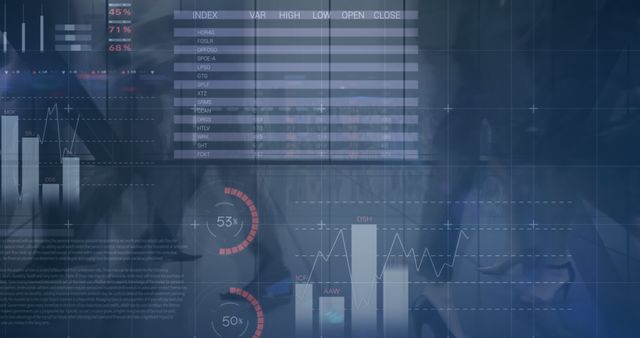
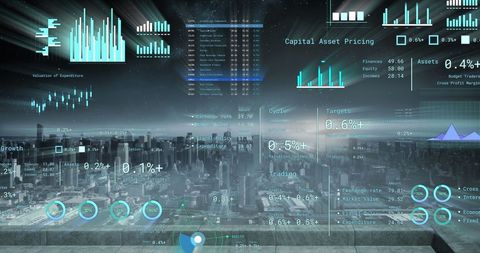
- Digital Data Processing and Analysis on Virtual Interface
Digital Data Processing and Analysis on Virtual Interface Image

Charts and graphs overlaying a computer server illuminate data analysis and processing, symbolizing global communication and technologies. Ideal for use in marketing materials related to IT services, data analytical service companies, digital transformation articles, and educational content about modern technology integration.

downloads
Tags:
More
Credit Photo
If you would like to credit the Photo, here are some ways you can do so
Text Link
photo Link
<span class="text-link">
<span>
<a target="_blank" href=https://pikwizard.com/photo/digital-data-processing-and-analysis-on-virtual-interface/f6a6de6a63cc5e37a7c34c3ea4770f67/>PikWizard</a>
</span>
</span>
<span class="image-link">
<span
style="margin: 0 0 20px 0; display: inline-block; vertical-align: middle; width: 100%;"
>
<a
target="_blank"
href="https://pikwizard.com/photo/digital-data-processing-and-analysis-on-virtual-interface/f6a6de6a63cc5e37a7c34c3ea4770f67/"
style="text-decoration: none; font-size: 10px; margin: 0;"
>
<img src="https://pikwizard.com/pw/medium/f6a6de6a63cc5e37a7c34c3ea4770f67.jpg" style="margin: 0; width: 100%;" alt="" />
<p style="font-size: 12px; margin: 0;">PikWizard</p>
</a>
</span>
</span>
Free (free of charge)
Free for personal and commercial use.
Author: People Creations