- Home >
- Stock Photos >
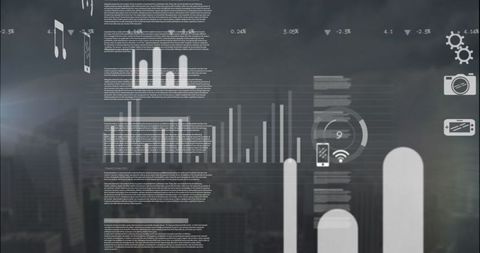
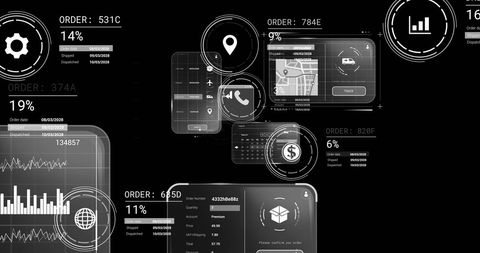
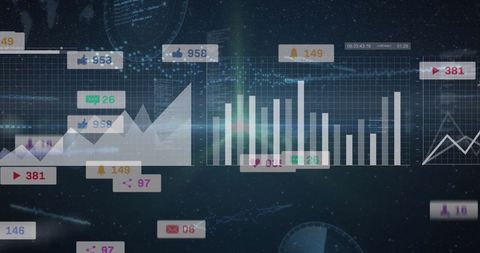
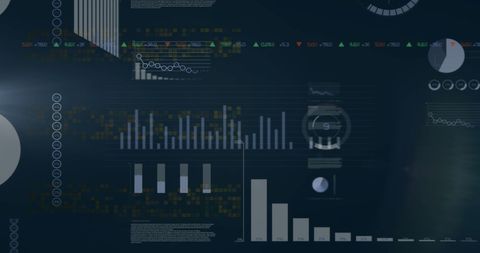
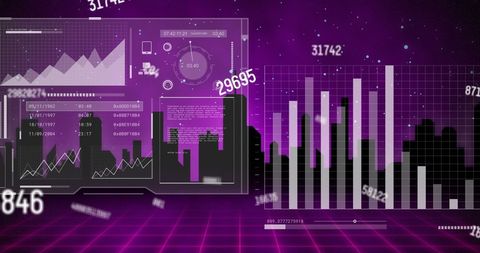
- Digital Data Processing and Analytics Visualization
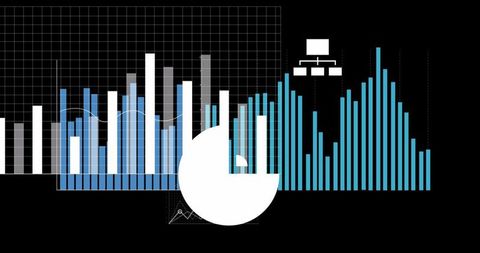
Digital Data Processing and Analytics Visualization Image

Illustrates digital data processing with charts and numeric graphics on a black background making it useful for business, technology, and finance presentations. Excellent for explaining complex analytics or data-driven insights visually.

downloads
Tags:
More
Credit Photo
If you would like to credit the Photo, here are some ways you can do so
Text Link
photo Link
<span class="text-link">
<span>
<a target="_blank" href=https://pikwizard.com/photo/digital-data-processing-and-analytics-visualization/ff3f713daddfbb1e7147d271215e78e2/>PikWizard</a>
</span>
</span>
<span class="image-link">
<span
style="margin: 0 0 20px 0; display: inline-block; vertical-align: middle; width: 100%;"
>
<a
target="_blank"
href="https://pikwizard.com/photo/digital-data-processing-and-analytics-visualization/ff3f713daddfbb1e7147d271215e78e2/"
style="text-decoration: none; font-size: 10px; margin: 0;"
>
<img src="https://pikwizard.com/pw/medium/ff3f713daddfbb1e7147d271215e78e2.jpg" style="margin: 0; width: 100%;" alt="" />
<p style="font-size: 12px; margin: 0;">PikWizard</p>
</a>
</span>
</span>
Free (free of charge)
Free for personal and commercial use.
Author: Awesome Content