- Home >
- Stock Photos >
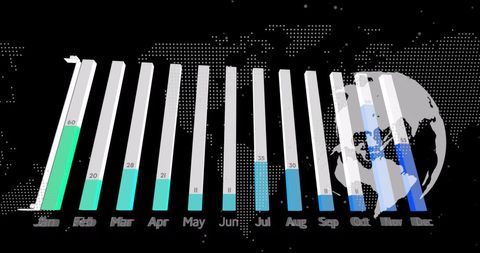
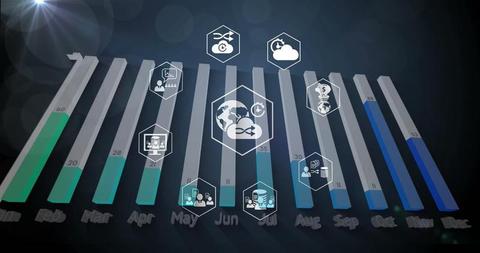
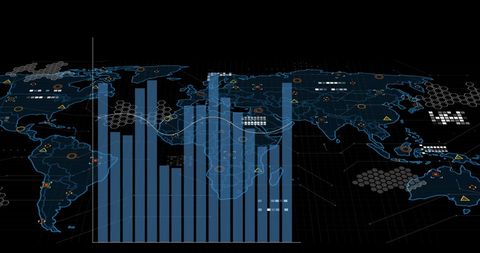
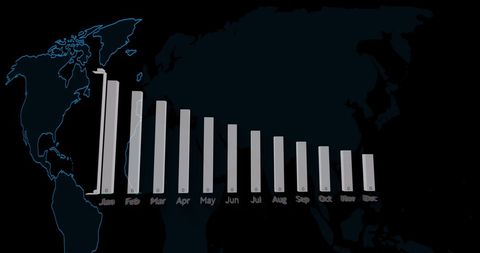
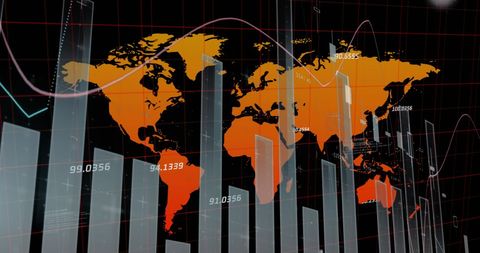
- Digital Data Processing and Global Statistics Visualization
Digital Data Processing and Global Statistics Visualization Image

Visually engaging representation of data visualization and processing techniques set against a digital world map. Ideal for businesses in technology, finance, or global analytics. Useful for illustrating articles on future technology trends, stock market insights, or international business dealings.

downloads
Tags:
More
Credit Photo
If you would like to credit the Photo, here are some ways you can do so
Text Link
photo Link
<span class="text-link">
<span>
<a target="_blank" href=https://pikwizard.com/photo/digital-data-processing-and-global-statistics-visualization/c113ece752c565921e0342be59694c04/>PikWizard</a>
</span>
</span>
<span class="image-link">
<span
style="margin: 0 0 20px 0; display: inline-block; vertical-align: middle; width: 100%;"
>
<a
target="_blank"
href="https://pikwizard.com/photo/digital-data-processing-and-global-statistics-visualization/c113ece752c565921e0342be59694c04/"
style="text-decoration: none; font-size: 10px; margin: 0;"
>
<img src="https://pikwizard.com/pw/medium/c113ece752c565921e0342be59694c04.jpg" style="margin: 0; width: 100%;" alt="" />
<p style="font-size: 12px; margin: 0;">PikWizard</p>
</a>
</span>
</span>
Free (free of charge)
Free for personal and commercial use.
Author: Authentic Images