
- Home >
- Stock Photos >
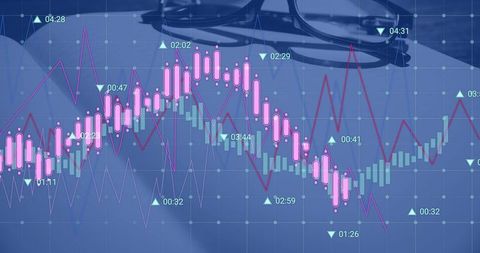
- Digital Data Processing Chart and Interface on Pink Background
Digital Data Processing Chart and Interface on Pink Background Image

This visualization features a vibrant pink background with various analytical graphs and diagrams, emphasizing data processing and technology. With financial charts and list interface components overlaying the background, it provides a modern and visually appealing representation of data analysis and business information. Useful for illustrating concepts in data management, analytics, and tech developments. Ideal for articles, presentations, or reports involved in financial technologies or business innovations.
Powered by 


downloads
Tags:
More
Credit Photo
If you would like to credit the Photo, here are some ways you can do so
Text Link
photo Link
<span class="text-link">
<span>
<a target="_blank" href=https://pikwizard.com/photo/digital-data-processing-chart-and-interface-on-pink-background/7792844094150a9c7d207460b443d7b7/>PikWizard</a>
</span>
</span>
<span class="image-link">
<span
style="margin: 0 0 20px 0; display: inline-block; vertical-align: middle; width: 100%;"
>
<a
target="_blank"
href="https://pikwizard.com/photo/digital-data-processing-chart-and-interface-on-pink-background/7792844094150a9c7d207460b443d7b7/"
style="text-decoration: none; font-size: 10px; margin: 0;"
>
<img src="https://pikwizard.com/pw/medium/7792844094150a9c7d207460b443d7b7.jpg" style="margin: 0; width: 100%;" alt="" />
<p style="font-size: 12px; margin: 0;">PikWizard</p>
</a>
</span>
</span>
Free (free of charge)
Free for personal and commercial use.
Author: Awesome Content
Similar Free Stock Images

Premium


Premium


Premium


Premium


AI


Premium


Premium


Premium


Premium

Premium

Premium


Premium


Premium

Premium


Premium


Premium


Premium

Premium


Premium


Premium


Premium


Premium


Premium


Premium


Premium

Premium


Explore More Free Stock Images