
- Home >
- Stock Photos >
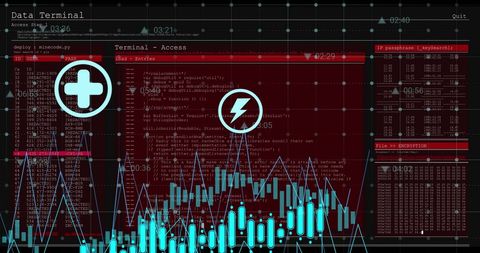
- Digital Data Processing Concept with Graphs and Icons
Digital Data Processing Concept with Graphs and Icons Image

Visualization of data processing with blue digital elements showcasing graphs and icons, ideal for illustrating technology-related articles and data analytics themes, highlighting digital transformation in businesses.
Powered by 


downloads
Tags:
More
Credit Photo
If you would like to credit the Photo, here are some ways you can do so
Text Link
photo Link
<span class="text-link">
<span>
<a target="_blank" href=https://pikwizard.com/photo/digital-data-processing-concept-with-graphs-and-icons/f966ef0981c824cbd1e80964d5902dc8/>PikWizard</a>
</span>
</span>
<span class="image-link">
<span
style="margin: 0 0 20px 0; display: inline-block; vertical-align: middle; width: 100%;"
>
<a
target="_blank"
href="https://pikwizard.com/photo/digital-data-processing-concept-with-graphs-and-icons/f966ef0981c824cbd1e80964d5902dc8/"
style="text-decoration: none; font-size: 10px; margin: 0;"
>
<img src="https://pikwizard.com/pw/medium/f966ef0981c824cbd1e80964d5902dc8.jpg" style="margin: 0; width: 100%;" alt="" />
<p style="font-size: 12px; margin: 0;">PikWizard</p>
</a>
</span>
</span>
Free (free of charge)
Free for personal and commercial use.
Author: Creative Art
Similar Free Stock Images

Premium


Premium

Premium


Premium


Premium


Premium


Premium


Premium


Premium

Premium


Premium


Premium


Premium


Premium


Premium


Premium


Premium


Premium

Premium

Premium


Premium


Premium


Premium


Premium


Premium

Explore More Free Stock Images