
- Home >
- Stock Photos >
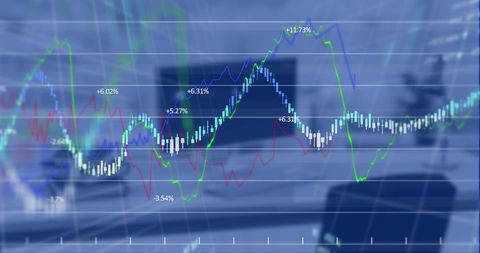
- Digital Data Processing Displaying Graphs Over Blurred Background
Digital Data Processing Displaying Graphs Over Blurred Background Image

This visual depicts complex data processing with digital graphs overlaying a blurred background. Ideal for showcasing technological advancements in data analytics, business presentations, or digital interface designs. Suitable for illustrating topics related to technology, global business strategies, or data-driven innovation.
Powered by  - Get 15% off with code: PIKWIZARD15


downloads
Tags:
More
Credit Photo
If you would like to credit the Photo, here are some ways you can do so
Text Link
photo Link
<span class="text-link">
<span>
<a target="_blank" href=https://pikwizard.com/photo/digital-data-processing-displaying-graphs-over-blurred-background/7dd531286763fa515070068a1a84c882/>PikWizard</a>
</span>
</span>
<span class="image-link">
<span
style="margin: 0 0 20px 0; display: inline-block; vertical-align: middle; width: 100%;"
>
<a
target="_blank"
href="https://pikwizard.com/photo/digital-data-processing-displaying-graphs-over-blurred-background/7dd531286763fa515070068a1a84c882/"
style="text-decoration: none; font-size: 10px; margin: 0;"
>
<img src="https://pikwizard.com/pw/medium/7dd531286763fa515070068a1a84c882.jpg" style="margin: 0; width: 100%;" alt="" />
<p style="font-size: 12px; margin: 0;">PikWizard</p>
</a>
</span>
</span>
Free (free of charge)
Free for personal and commercial use.
Author: Creative Art
Similar Free Stock Images

Premium


Premium

Premium


Premium

Premium


Premium


Premium


Premium


Premium

Premium

Premium


Premium

Premium


Premium

Premium


Premium


Premium


Premium


Premium


Premium

Premium

Premium

Premium


Premium


Premium


Explore More Free Stock Images