
- Home >
- Stock Photos >
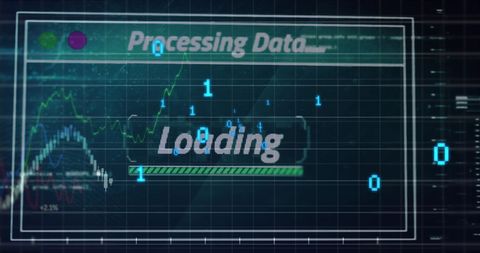
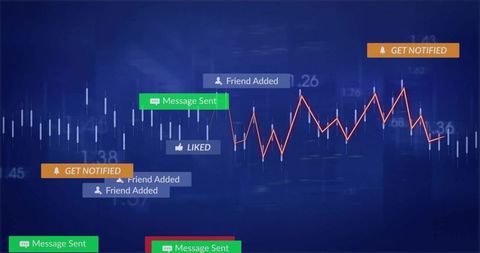
- Digital Data Processing Graph Interface with Progress Bar
Digital Data Processing Graph Interface with Progress Bar Image

Display features a combination of numerical growth indicators, data lines, and an active progress bar on a grid looped covering. Perfect for representing themes related to technology, big data analysis, and visual data representation. Suitable for use in presentations on analytics or technology fuels results driven businesses.
Powered by  - Get 15% off with code: PIKWIZARD15


downloads
Tags:
More
Credit Photo
If you would like to credit the Photo, here are some ways you can do so
Text Link
photo Link
<span class="text-link">
<span>
<a target="_blank" href=https://pikwizard.com/photo/digital-data-processing-graph-interface-with-progress-bar/d8177f7f4ae0af6336ccde2b769ff593/>PikWizard</a>
</span>
</span>
<span class="image-link">
<span
style="margin: 0 0 20px 0; display: inline-block; vertical-align: middle; width: 100%;"
>
<a
target="_blank"
href="https://pikwizard.com/photo/digital-data-processing-graph-interface-with-progress-bar/d8177f7f4ae0af6336ccde2b769ff593/"
style="text-decoration: none; font-size: 10px; margin: 0;"
>
<img src="https://pikwizard.com/pw/medium/d8177f7f4ae0af6336ccde2b769ff593.jpg" style="margin: 0; width: 100%;" alt="" />
<p style="font-size: 12px; margin: 0;">PikWizard</p>
</a>
</span>
</span>
Free (free of charge)
Free for personal and commercial use.
Author: People Creations
Similar Free Stock Images

Premium


Premium


Premium


Premium


Premium


Premium


Premium

Premium


Premium


Premium


Premium


Premium


Premium


AI


Premium


Premium


Premium


Premium


Premium


Premium


Premium


Premium

Premium


Premium


Premium


Premium


Explore More Free Stock Images