- Home >
- Stock Photos >
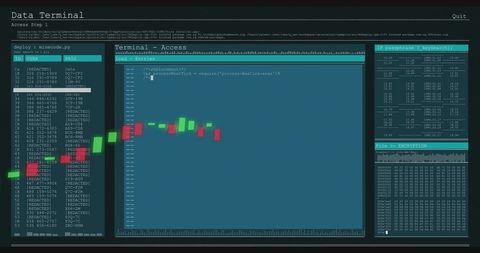
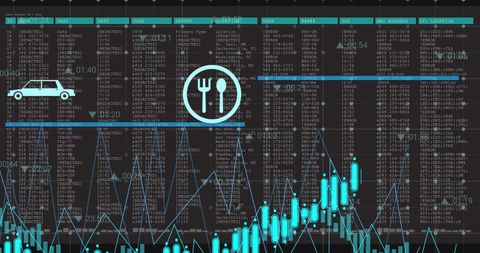
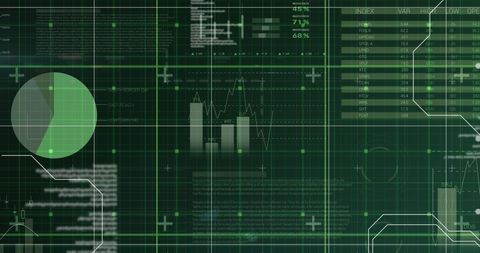
- Digital Data Processing Interface with Candlestick Charts
Digital Data Processing Interface with Candlestick Charts Image
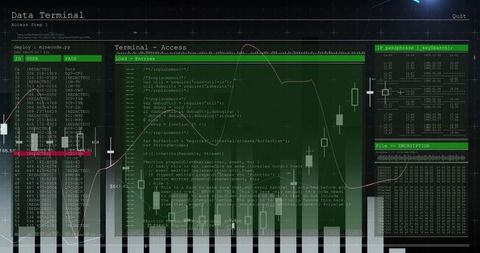
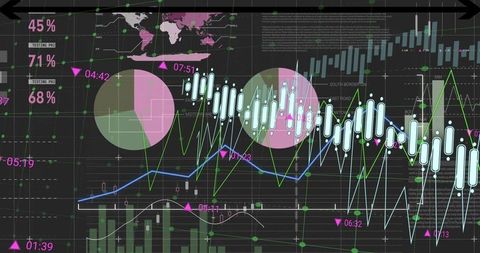
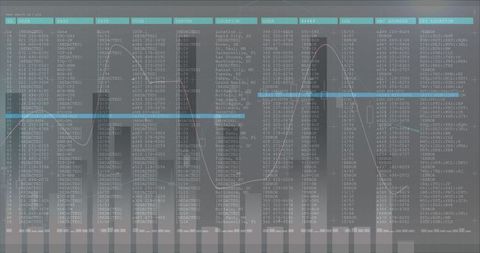
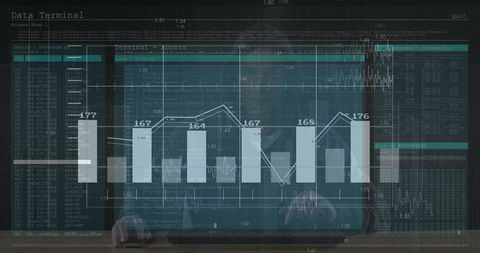
Visual representation of digital data processing exhibiting code, charts, and encryption screens. Ideal for illustrating concepts related to data analysis, cyber security, financial technology, and digital interfaces. Can be utilized in presentations, articles, or websites focused on technology and computational analysis.

downloads
Tags:
More
Credit Photo
If you would like to credit the Photo, here are some ways you can do so
Text Link
photo Link
<span class="text-link">
<span>
<a target="_blank" href=https://pikwizard.com/photo/digital-data-processing-interface-with-candlestick-charts/2d0b1477a436ef859448fb90a38bb07f/>PikWizard</a>
</span>
</span>
<span class="image-link">
<span
style="margin: 0 0 20px 0; display: inline-block; vertical-align: middle; width: 100%;"
>
<a
target="_blank"
href="https://pikwizard.com/photo/digital-data-processing-interface-with-candlestick-charts/2d0b1477a436ef859448fb90a38bb07f/"
style="text-decoration: none; font-size: 10px; margin: 0;"
>
<img src="https://pikwizard.com/pw/medium/2d0b1477a436ef859448fb90a38bb07f.jpg" style="margin: 0; width: 100%;" alt="" />
<p style="font-size: 12px; margin: 0;">PikWizard</p>
</a>
</span>
</span>
Free (free of charge)
Free for personal and commercial use.
Author: Creative Art