- Home >
- Stock Photos >
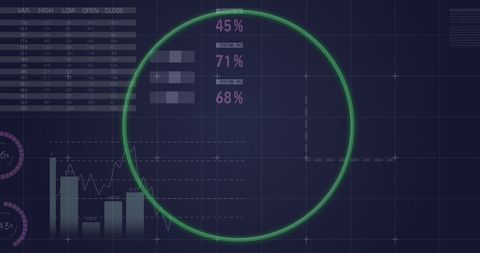
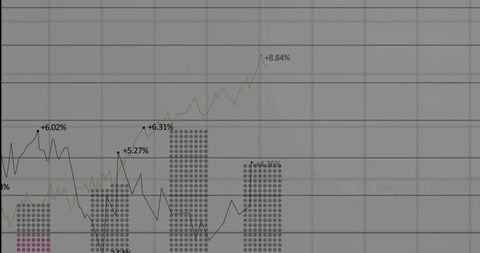
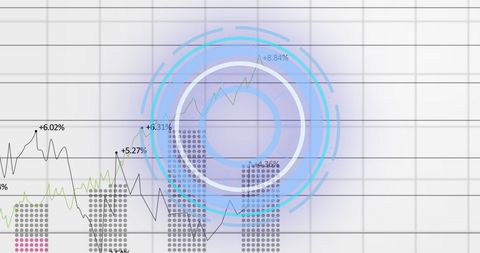
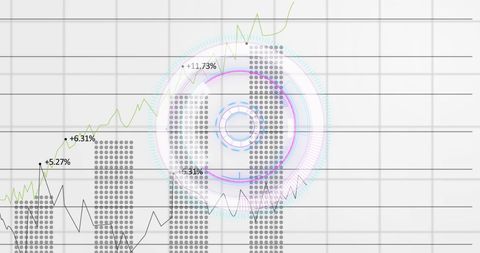
- Digital Data Processing Interface with Graph Analysis
Digital Data Processing Interface with Graph Analysis Image

Visualization of data with graphs and digital interfaces symbolizing technological advancements. Useful for presentations, articles on data analytics, business reports, or educational purposes related to digital advancements.

downloads
Tags:
More
Credit Photo
If you would like to credit the Photo, here are some ways you can do so
Text Link
photo Link
<span class="text-link">
<span>
<a target="_blank" href=https://pikwizard.com/photo/digital-data-processing-interface-with-graph-analysis/384f86547c475c2080eb87d97a5c4bd4/>PikWizard</a>
</span>
</span>
<span class="image-link">
<span
style="margin: 0 0 20px 0; display: inline-block; vertical-align: middle; width: 100%;"
>
<a
target="_blank"
href="https://pikwizard.com/photo/digital-data-processing-interface-with-graph-analysis/384f86547c475c2080eb87d97a5c4bd4/"
style="text-decoration: none; font-size: 10px; margin: 0;"
>
<img src="https://pikwizard.com/pw/medium/384f86547c475c2080eb87d97a5c4bd4.jpg" style="margin: 0; width: 100%;" alt="" />
<p style="font-size: 12px; margin: 0;">PikWizard</p>
</a>
</span>
</span>
Free (free of charge)
Free for personal and commercial use.
Author: People Creations