- Home >
- Stock Photos >
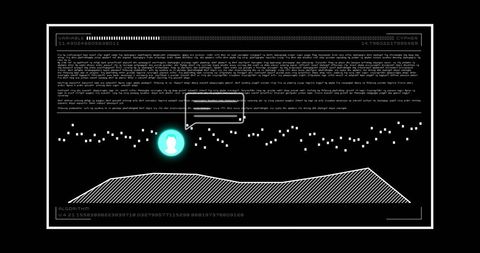
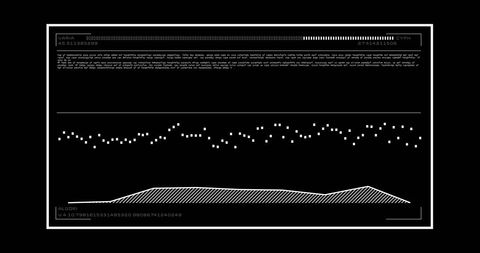
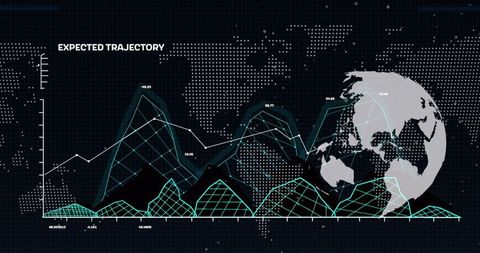
- Digital Data Processing Interface with Graphs and Protocol Display
Digital Data Processing Interface with Graphs and Protocol Display Image
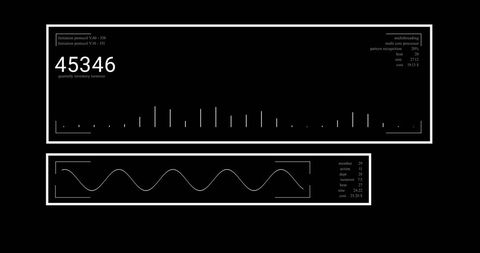
Depicting a digital data processing interface, this image showcases graphs and protocol displays. Often used in contexts involving technology or analytics presentations, it highlights concepts of global business intelligence. Suitable for illustrating articles on data handling or needs for business analytics, it adds a modern and technical visual element.

downloads
Tags:
More
Credit Photo
If you would like to credit the Photo, here are some ways you can do so
Text Link
photo Link
<span class="text-link">
<span>
<a target="_blank" href=https://pikwizard.com/photo/digital-data-processing-interface-with-graphs-and-protocol-display/4d4b8c2b7aa99908c09e793ba613b351/>PikWizard</a>
</span>
</span>
<span class="image-link">
<span
style="margin: 0 0 20px 0; display: inline-block; vertical-align: middle; width: 100%;"
>
<a
target="_blank"
href="https://pikwizard.com/photo/digital-data-processing-interface-with-graphs-and-protocol-display/4d4b8c2b7aa99908c09e793ba613b351/"
style="text-decoration: none; font-size: 10px; margin: 0;"
>
<img src="https://pikwizard.com/pw/medium/4d4b8c2b7aa99908c09e793ba613b351.jpg" style="margin: 0; width: 100%;" alt="" />
<p style="font-size: 12px; margin: 0;">PikWizard</p>
</a>
</span>
</span>
Free (free of charge)
Free for personal and commercial use.
Author: Authentic Images