
- Home >
- Stock Photos >
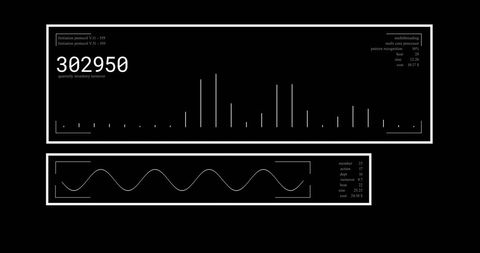
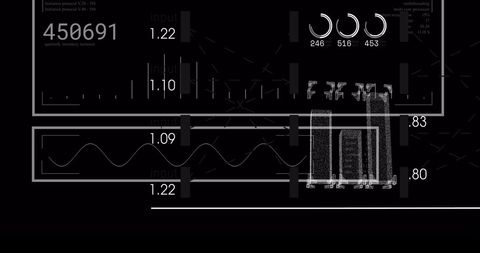
- Digital Data Processing Interface with Grid and Metrics
Digital Data Processing Interface with Grid and Metrics Image
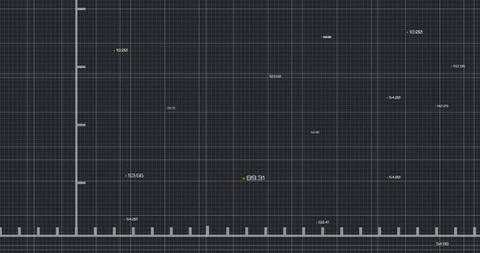
This image features a technologically advanced interface displaying data and metrics on a dark grid background, suggesting themes of digital data processing and financial analytics. Useful for illustrating concepts in global business strategies, technology-driven solutions, or financial data analysis in presentations, marketing materials, or website design focused on innovation and modern business tools.
Powered by 


downloads
Tags:
More
Credit Photo
If you would like to credit the Photo, here are some ways you can do so
Text Link
photo Link
<span class="text-link">
<span>
<a target="_blank" href=https://pikwizard.com/photo/digital-data-processing-interface-with-grid-and-metrics/c3646eff2484e00c3ef109f8e1521d61/>PikWizard</a>
</span>
</span>
<span class="image-link">
<span
style="margin: 0 0 20px 0; display: inline-block; vertical-align: middle; width: 100%;"
>
<a
target="_blank"
href="https://pikwizard.com/photo/digital-data-processing-interface-with-grid-and-metrics/c3646eff2484e00c3ef109f8e1521d61/"
style="text-decoration: none; font-size: 10px; margin: 0;"
>
<img src="https://pikwizard.com/pw/medium/c3646eff2484e00c3ef109f8e1521d61.jpg" style="margin: 0; width: 100%;" alt="" />
<p style="font-size: 12px; margin: 0;">PikWizard</p>
</a>
</span>
</span>
Free (free of charge)
Free for personal and commercial use.
Author: People Creations
Similar Free Stock Images

Premium


Premium

Premium


Premium


Premium


Premium


Premium


Premium


Premium
Premium

Premium


Premium


Premium


Premium


Premium


Premium


Premium


Premium


Premium


Premium


Premium


Premium


Premium


Premium


Premium

Explore More Free Stock Images