- Home >
- Stock Photos >
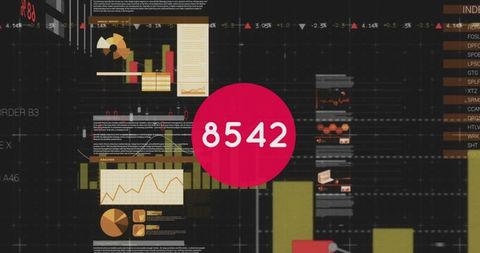
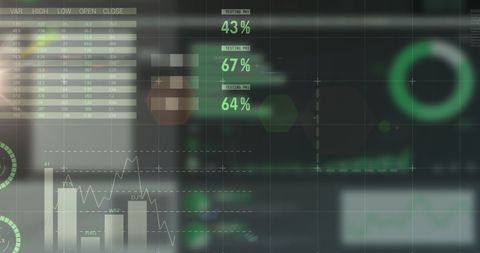
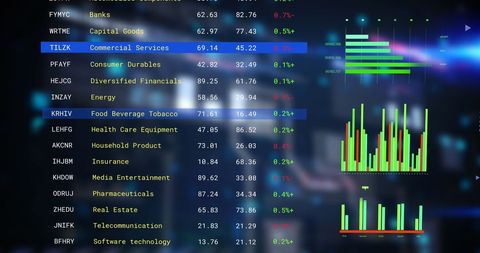
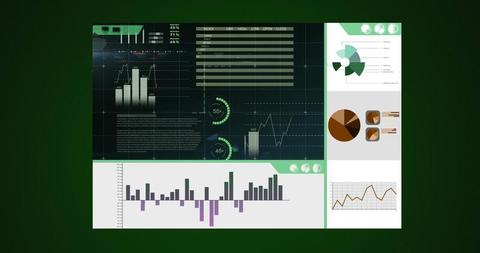
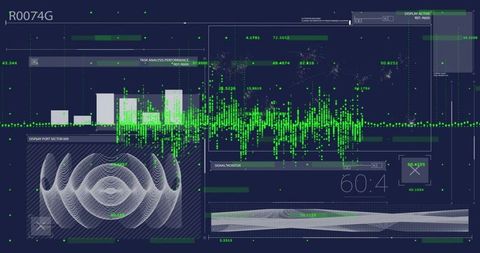
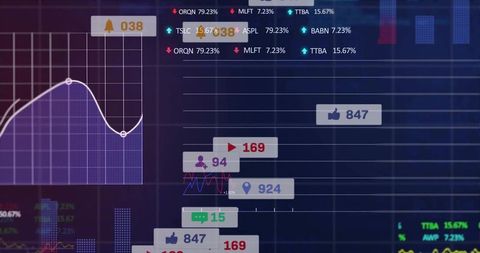
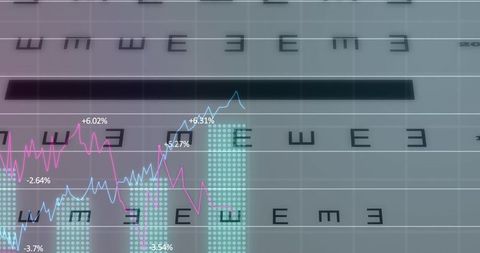
- Digital Data Processing Interfaces with Graphs and Charts
Digital Data Processing Interfaces with Graphs and Charts Image

Digital data processing is displayed with various charts, graphs, and analytical figures. Ideal for illustrating concepts of modern business solutions, global connectivity in a tech-centric environment, and advancements in digital tooling for finance. Suitable for use in presentations, tech articles, and business seminars.

downloads
Tags:
More
Credit Photo
If you would like to credit the Photo, here are some ways you can do so
Text Link
photo Link
<span class="text-link">
<span>
<a target="_blank" href=https://pikwizard.com/photo/digital-data-processing-interfaces-with-graphs-and-charts/613a44f1bd12e00f40905f7a3a7f142a/>PikWizard</a>
</span>
</span>
<span class="image-link">
<span
style="margin: 0 0 20px 0; display: inline-block; vertical-align: middle; width: 100%;"
>
<a
target="_blank"
href="https://pikwizard.com/photo/digital-data-processing-interfaces-with-graphs-and-charts/613a44f1bd12e00f40905f7a3a7f142a/"
style="text-decoration: none; font-size: 10px; margin: 0;"
>
<img src="https://pikwizard.com/pw/medium/613a44f1bd12e00f40905f7a3a7f142a.jpg" style="margin: 0; width: 100%;" alt="" />
<p style="font-size: 12px; margin: 0;">PikWizard</p>
</a>
</span>
</span>
Free (free of charge)
Free for personal and commercial use.
Author: People Creations