
- Home >
- Stock Photos >
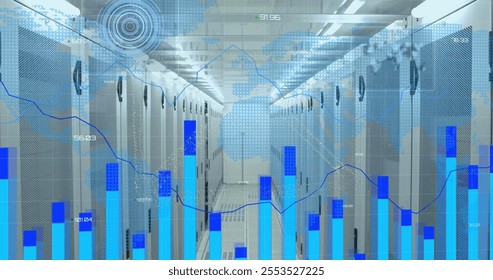
- Digital Data Processing on High-Tech Interface with Graphs
Digital Data Processing on High-Tech Interface with Graphs Image

Dynamic visual represents digital data processing and analysis on a futuristic interface. Features include graphs and binary code indicating advanced technology utilization for data-driven insights. Ideal for illustrating concepts of big data, analytics, and technological advances in data management.
Powered by  - Get 15% off with code: PIKWIZARD15


downloads
Tags:
More
Credit Photo
If you would like to credit the Photo, here are some ways you can do so
Text Link
photo Link
<span class="text-link">
<span>
<a target="_blank" href=https://pikwizard.com/photo/digital-data-processing-on-high-tech-interface-with-graphs/e25f103f5f55d0f3286b3536eebbed03/>PikWizard</a>
</span>
</span>
<span class="image-link">
<span
style="margin: 0 0 20px 0; display: inline-block; vertical-align: middle; width: 100%;"
>
<a
target="_blank"
href="https://pikwizard.com/photo/digital-data-processing-on-high-tech-interface-with-graphs/e25f103f5f55d0f3286b3536eebbed03/"
style="text-decoration: none; font-size: 10px; margin: 0;"
>
<img src="https://pikwizard.com/pw/medium/e25f103f5f55d0f3286b3536eebbed03.jpg" style="margin: 0; width: 100%;" alt="" />
<p style="font-size: 12px; margin: 0;">PikWizard</p>
</a>
</span>
</span>
Free (free of charge)
Free for personal and commercial use.
Author: Creative Art
Similar Free Stock Images

Premium


Premium

Premium


Premium


Premium


Premium


Premium


Premium


Premium


Premium


Premium


Premium


Premium


Premium


Premium


Premium


Premium


Premium


Premium


Premium


Premium


Premium


Premium


Premium


Premium


Explore More Free Stock Images