- Home >
- Stock Photos >
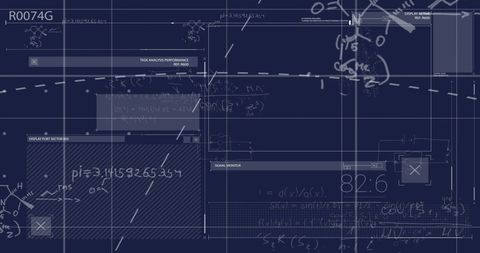
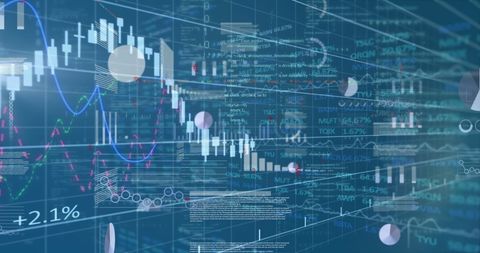
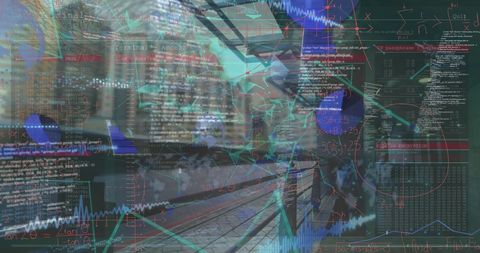
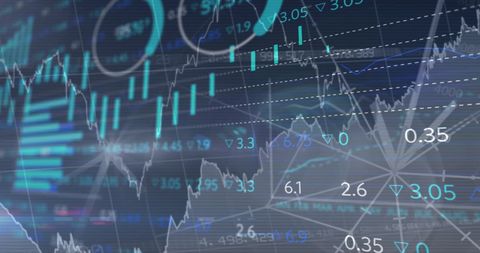
- Digital Data Processing on Tech Screens with Graphs and Figures
Digital Data Processing on Tech Screens with Graphs and Figures Image
Graphic representation of data frames on high-tech virtual screens illustrates financial or technical analytics. Suitable for business presentations on data analysis, technological innovations, forecasting, and showcasing advanced data visualization techniques.

downloads
Tags:
More
Credit Photo
If you would like to credit the Photo, here are some ways you can do so
Text Link
photo Link
<span class="text-link">
<span>
<a target="_blank" href=https://pikwizard.com/photo/digital-data-processing-on-tech-screens-with-graphs-and-figures/11e0cd6630c90eaa0215168477bd53e1/>PikWizard</a>
</span>
</span>
<span class="image-link">
<span
style="margin: 0 0 20px 0; display: inline-block; vertical-align: middle; width: 100%;"
>
<a
target="_blank"
href="https://pikwizard.com/photo/digital-data-processing-on-tech-screens-with-graphs-and-figures/11e0cd6630c90eaa0215168477bd53e1/"
style="text-decoration: none; font-size: 10px; margin: 0;"
>
<img src="https://pikwizard.com/pw/medium/11e0cd6630c90eaa0215168477bd53e1.jpg" style="margin: 0; width: 100%;" alt="" />
<p style="font-size: 12px; margin: 0;">PikWizard</p>
</a>
</span>
</span>
Free (free of charge)
Free for personal and commercial use.
Author: Creative Art