- Home >
- Stock Photos >
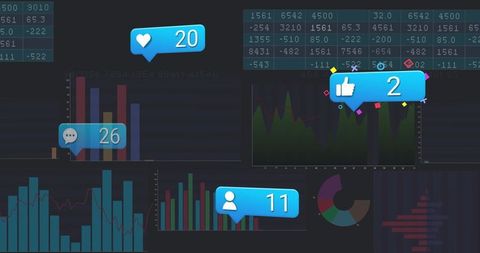
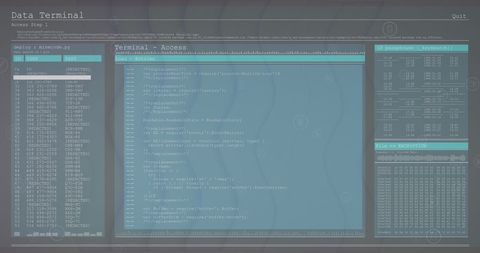
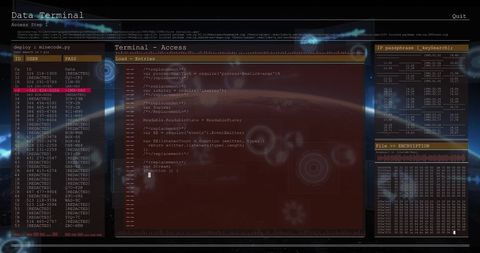
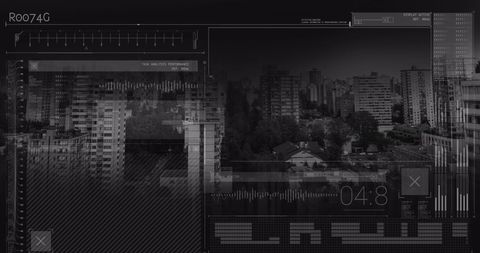
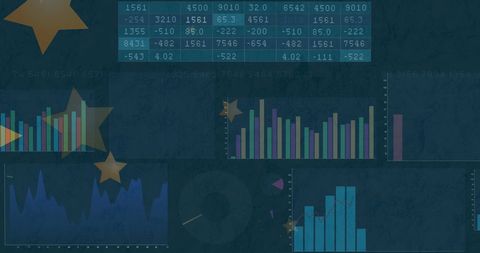
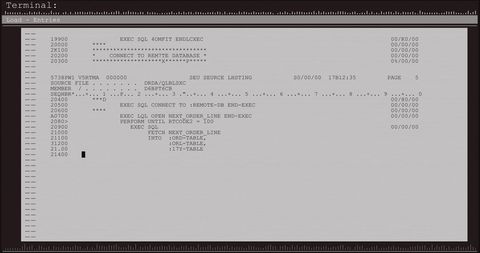
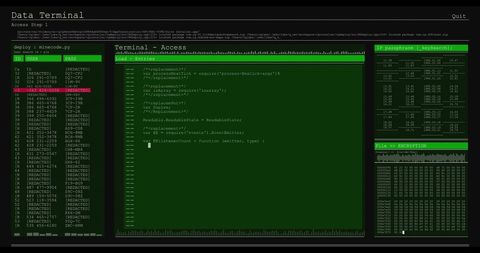
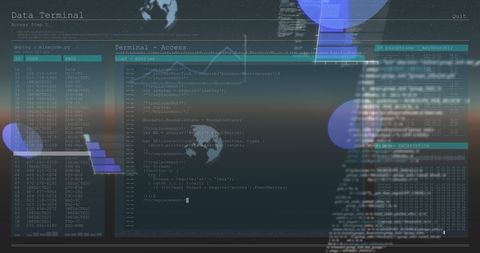
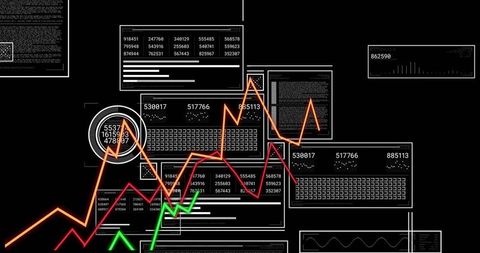
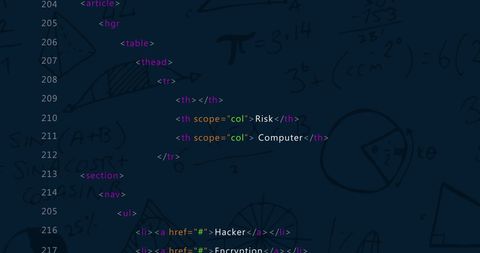
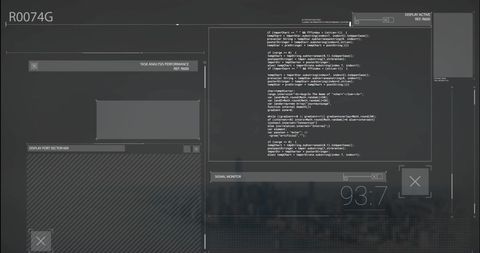
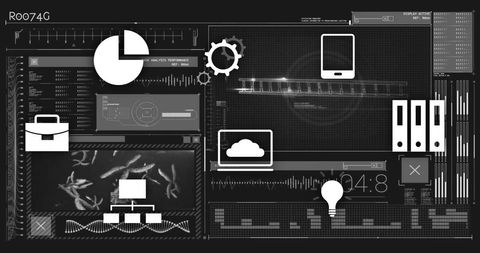
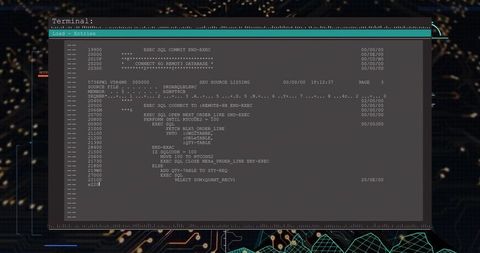
- Digital Data Processing Over Code with Analytics Charts
Digital Data Processing Over Code with Analytics Charts Image

Displays fusion of data processing, coding terminal window, and analytical charts. Ideal for illustrating concepts of software development, tech innovation, or data analysis. Valuable for educational presentations, tech blogs, or business publications discussing digital transformation or data-driven strategies.

downloads
Tags:
More
Credit Photo
If you would like to credit the Photo, here are some ways you can do so
Text Link
photo Link
<span class="text-link">
<span>
<a target="_blank" href=https://pikwizard.com/photo/digital-data-processing-over-code-with-analytics-charts/ca146f00cbdc3652ecee974e4fc8ace2/>PikWizard</a>
</span>
</span>
<span class="image-link">
<span
style="margin: 0 0 20px 0; display: inline-block; vertical-align: middle; width: 100%;"
>
<a
target="_blank"
href="https://pikwizard.com/photo/digital-data-processing-over-code-with-analytics-charts/ca146f00cbdc3652ecee974e4fc8ace2/"
style="text-decoration: none; font-size: 10px; margin: 0;"
>
<img src="https://pikwizard.com/pw/medium/ca146f00cbdc3652ecee974e4fc8ace2.jpg" style="margin: 0; width: 100%;" alt="" />
<p style="font-size: 12px; margin: 0;">PikWizard</p>
</a>
</span>
</span>
Free (free of charge)
Free for personal and commercial use.
Author: Creative Art