
- Home >
- Stock Photos >
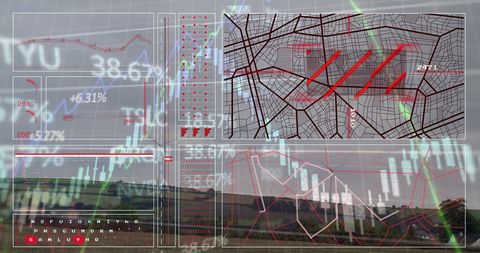
- Digital Data Processing Over Globe with Map Visualization
Digital Data Processing Over Globe with Map Visualization Image

Dynamic visualization of data processing overlaid on globe and map elements signifies interconnected global networks. Ideal for illustrating themes of global connectivity, data analysis, and technology interaction. Suitable for use in presentations, articles, and websites focused on data science, global studies, or tech innovation.
Powered by  - Get 15% off with code: PIKWIZARD15


downloads
Tags:
More
Credit Photo
If you would like to credit the Photo, here are some ways you can do so
Text Link
photo Link
<span class="text-link">
<span>
<a target="_blank" href=https://pikwizard.com/photo/digital-data-processing-over-globe-with-map-visualization/7aaf3f591b566c56468b7481067ef7c0/>PikWizard</a>
</span>
</span>
<span class="image-link">
<span
style="margin: 0 0 20px 0; display: inline-block; vertical-align: middle; width: 100%;"
>
<a
target="_blank"
href="https://pikwizard.com/photo/digital-data-processing-over-globe-with-map-visualization/7aaf3f591b566c56468b7481067ef7c0/"
style="text-decoration: none; font-size: 10px; margin: 0;"
>
<img src="https://pikwizard.com/pw/medium/7aaf3f591b566c56468b7481067ef7c0.jpg" style="margin: 0; width: 100%;" alt="" />
<p style="font-size: 12px; margin: 0;">PikWizard</p>
</a>
</span>
</span>
Free (free of charge)
Free for personal and commercial use.
Author: People Creations
Similar Free Stock Images

Premium


Premium

Premium


Premium


Premium


Premium


Premium


Premium


Premium


Premium


Premium


Premium


Premium


Premium


Premium


Premium

Premium


Premium

Premium


Premium


Premium


Premium

Premium


Premium


Premium


Explore More Free Stock Images