- Home >
- Stock Photos >
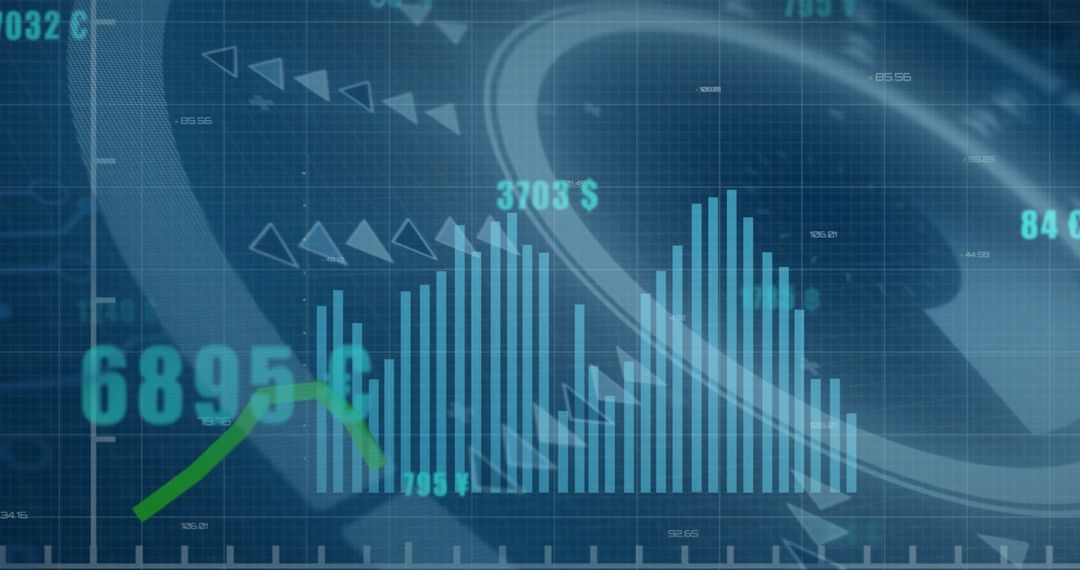
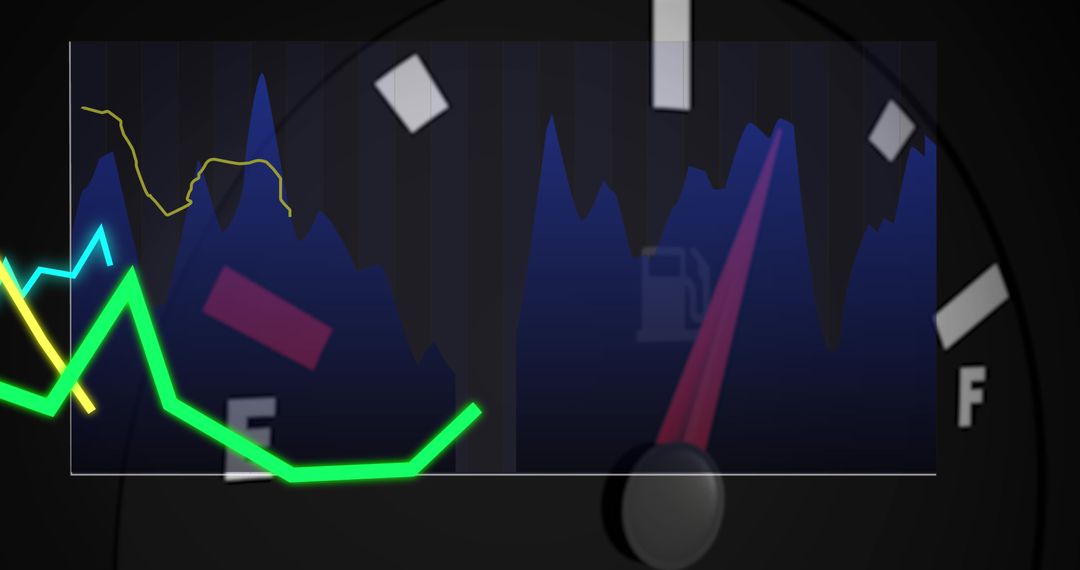
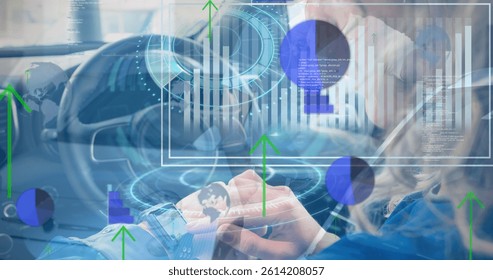
- Digital Data Processing Overlaid on Car Dashboard
Digital Data Processing Overlaid on Car Dashboard Image
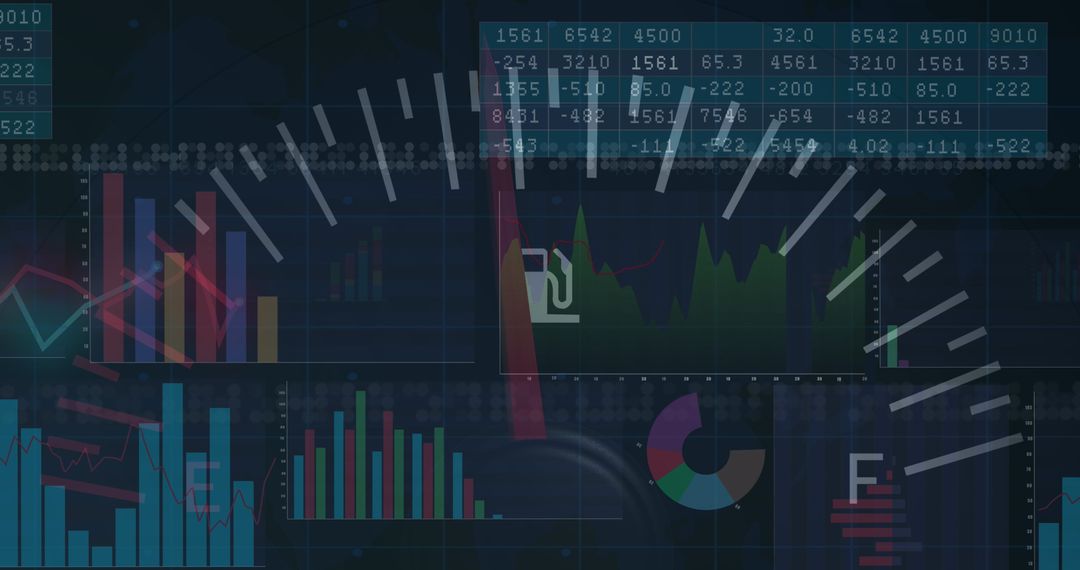
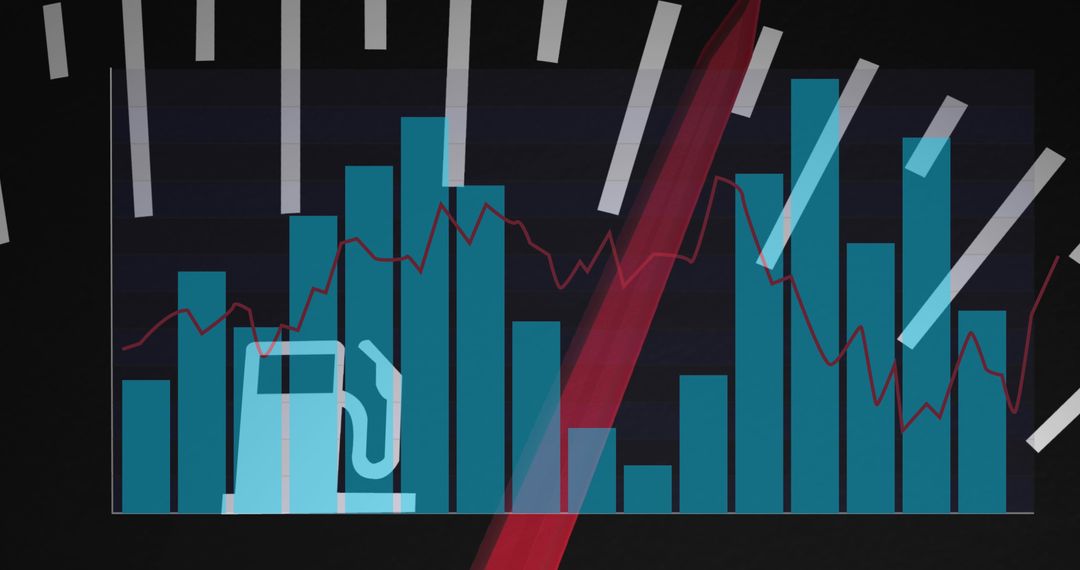
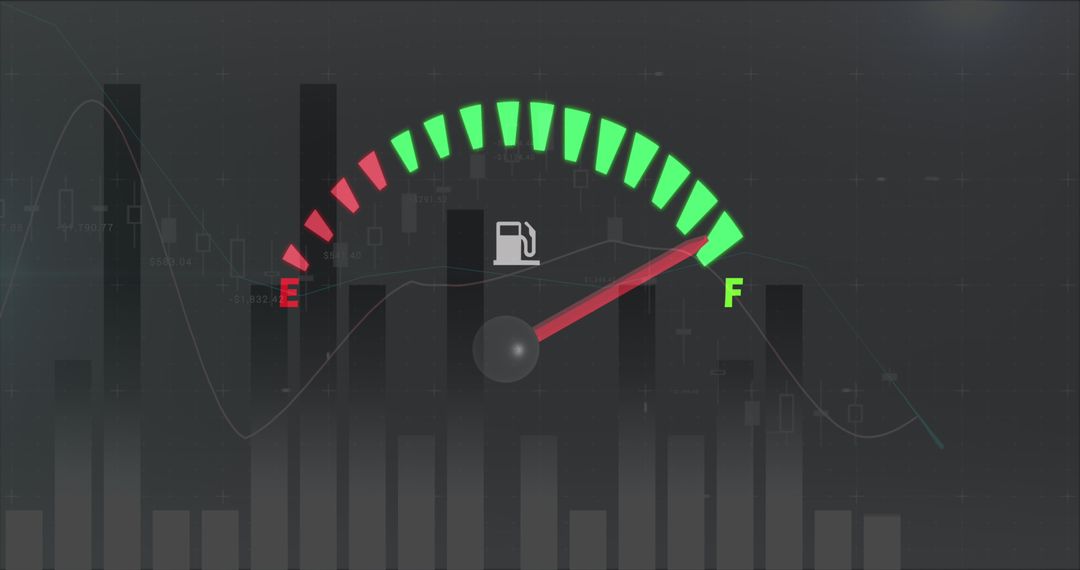
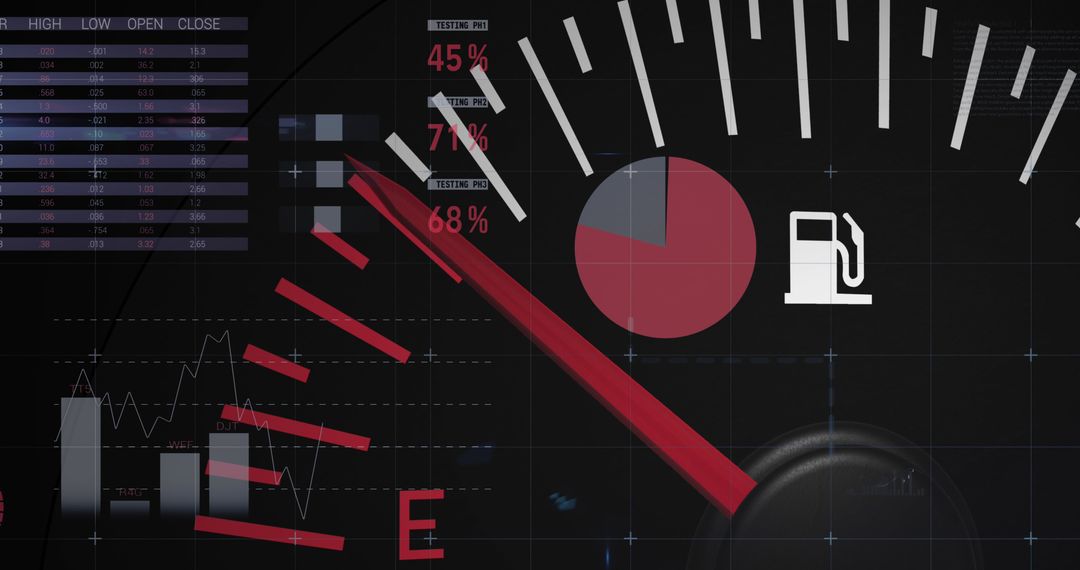
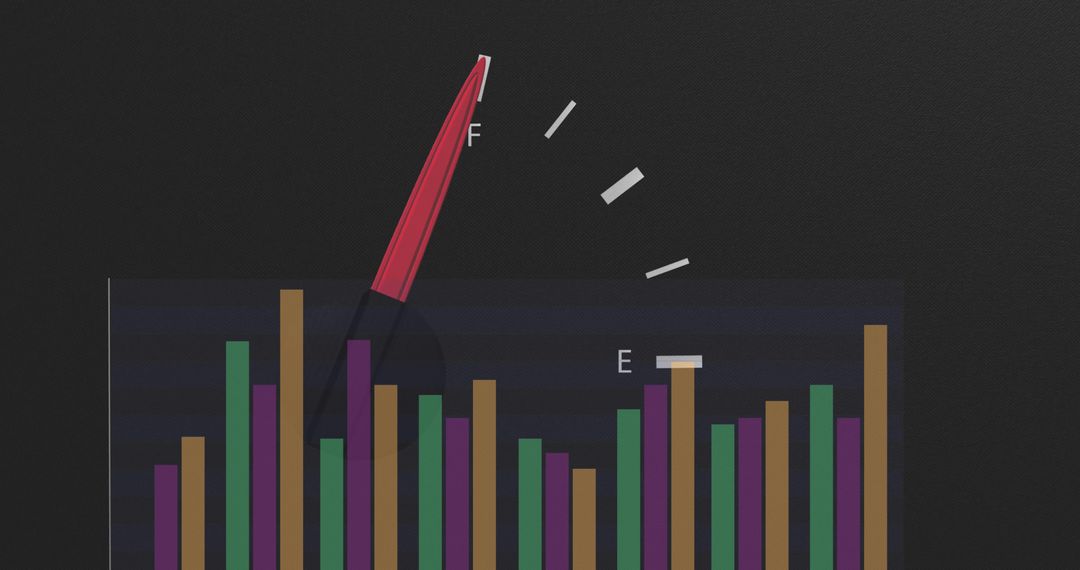
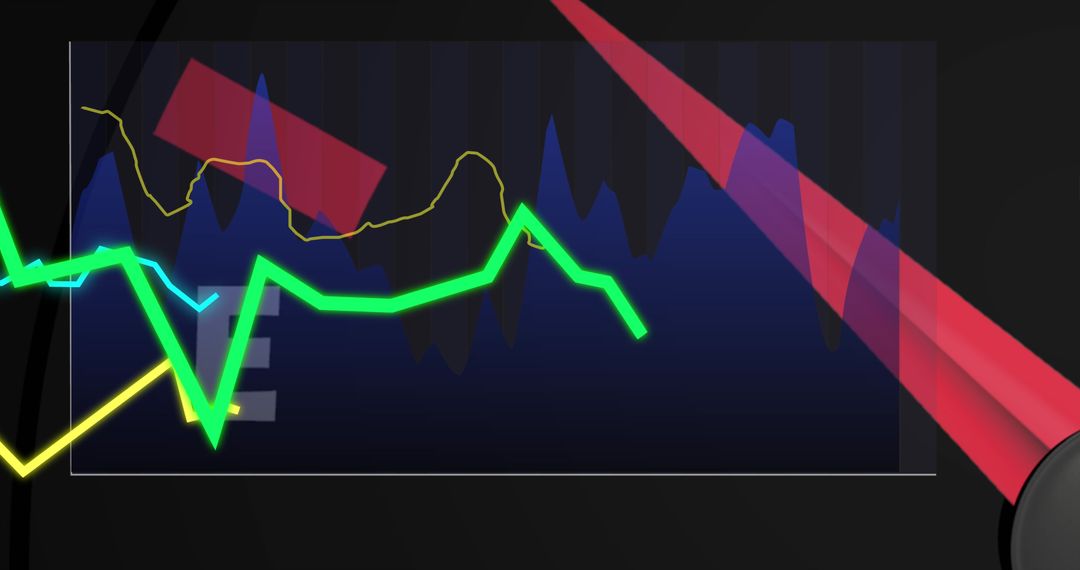
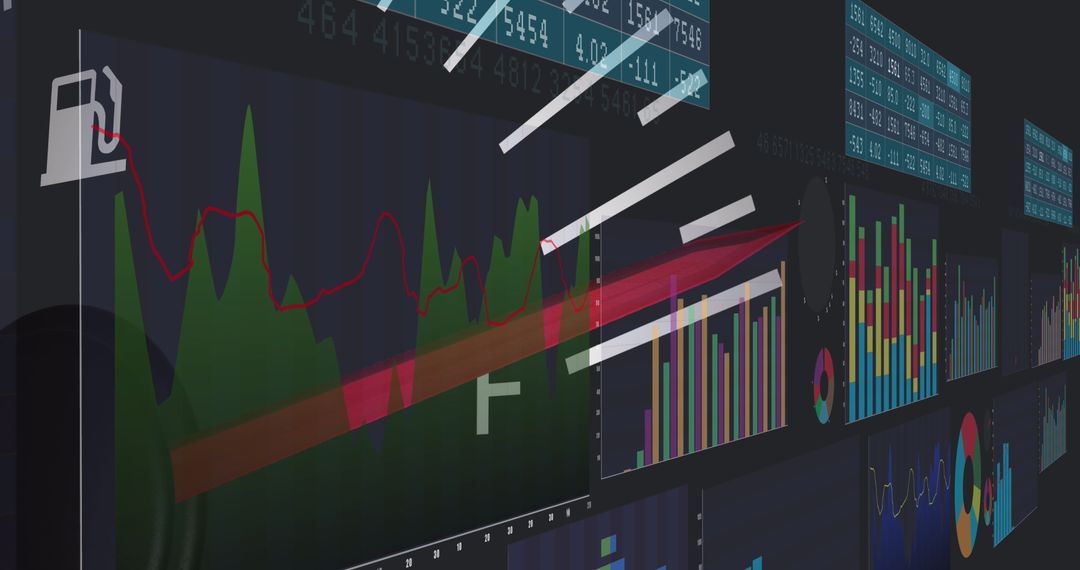
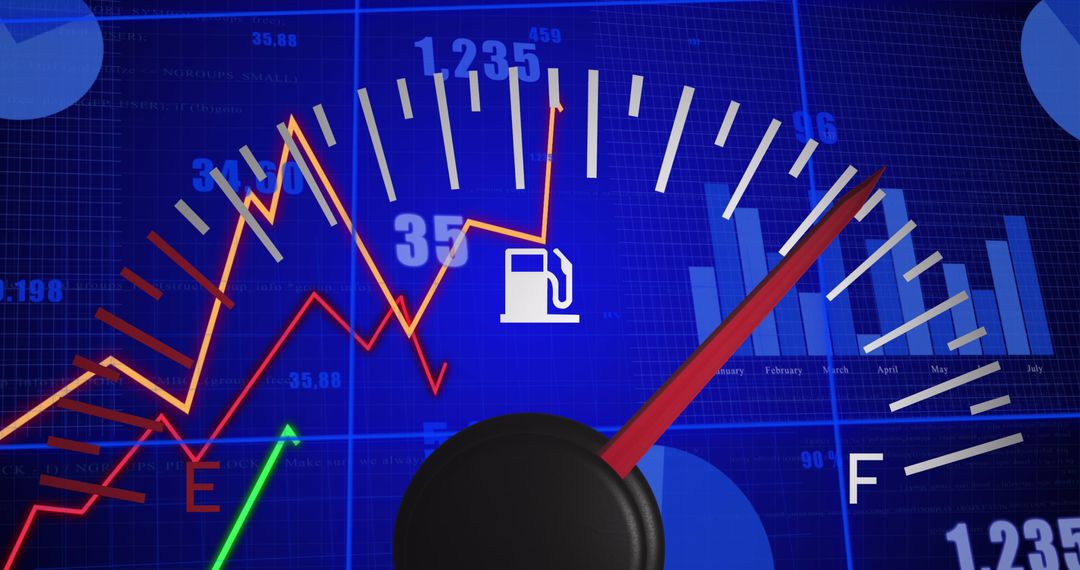
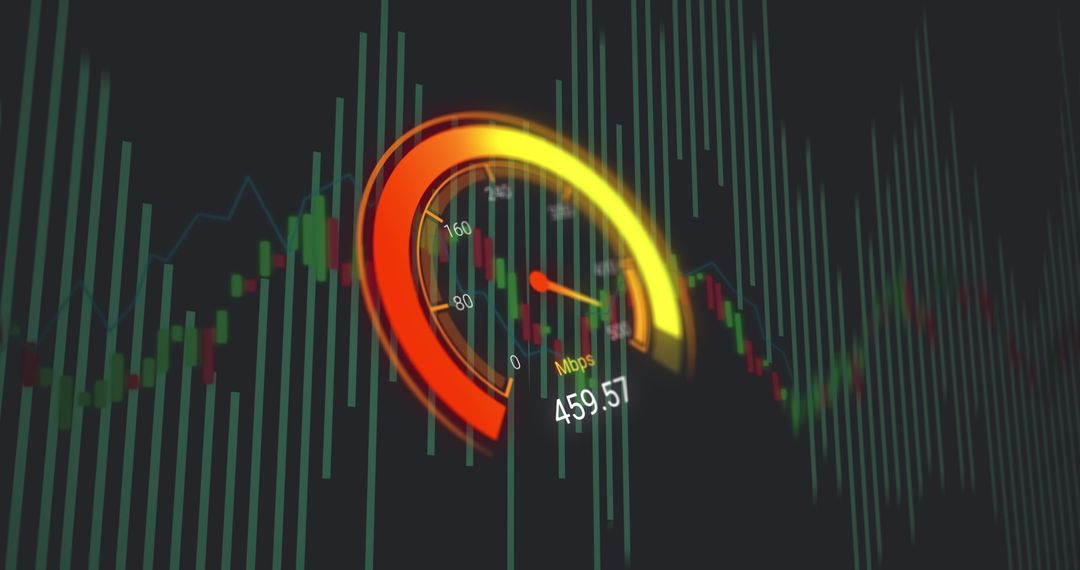
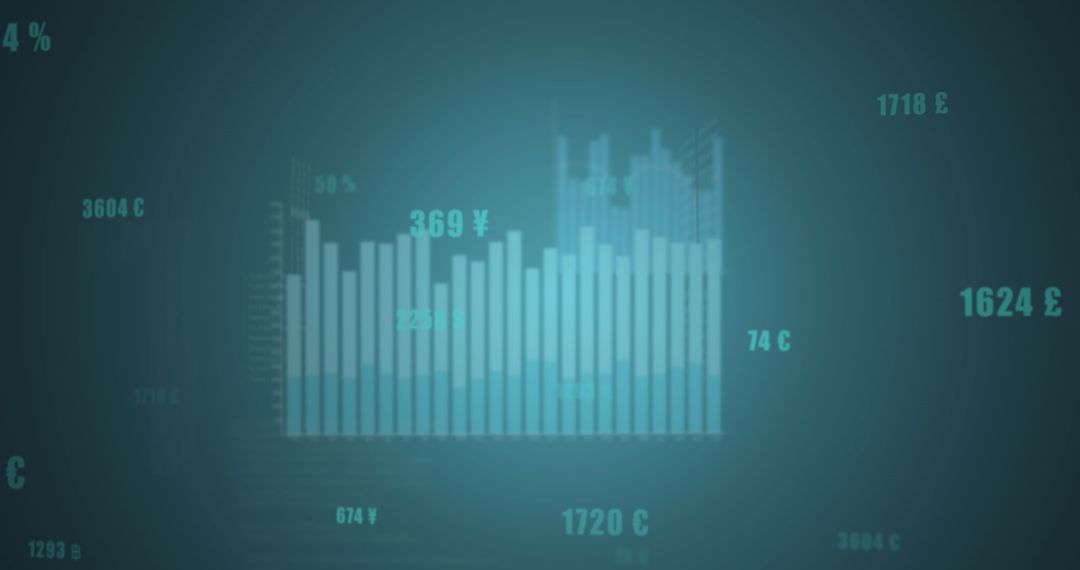
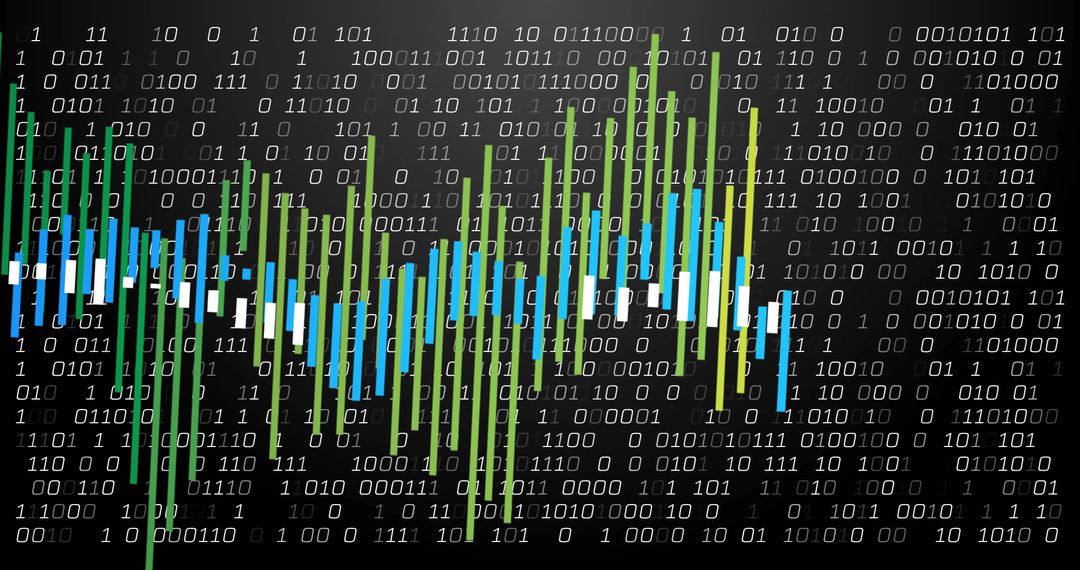
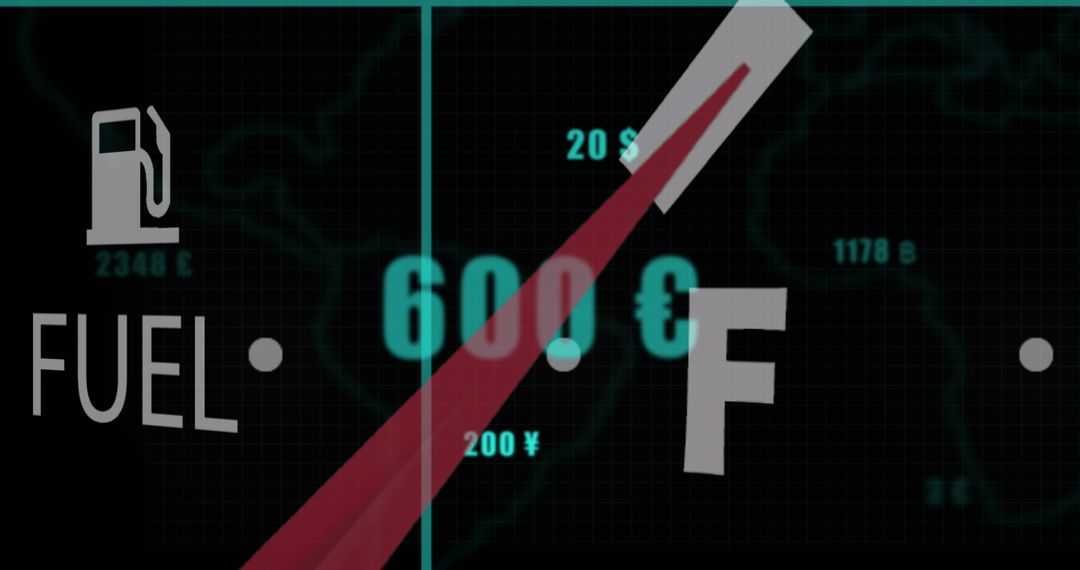
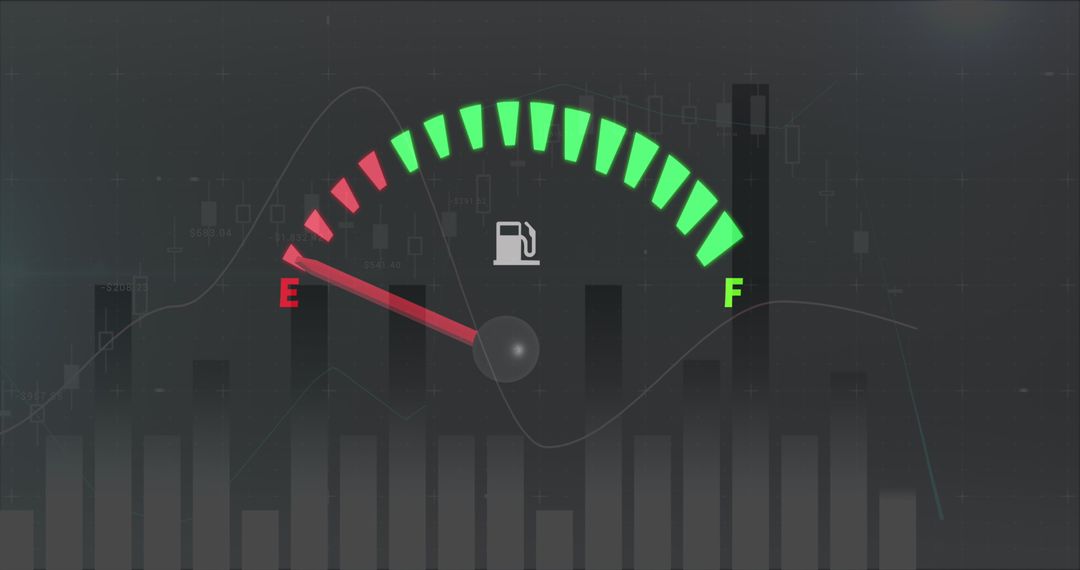
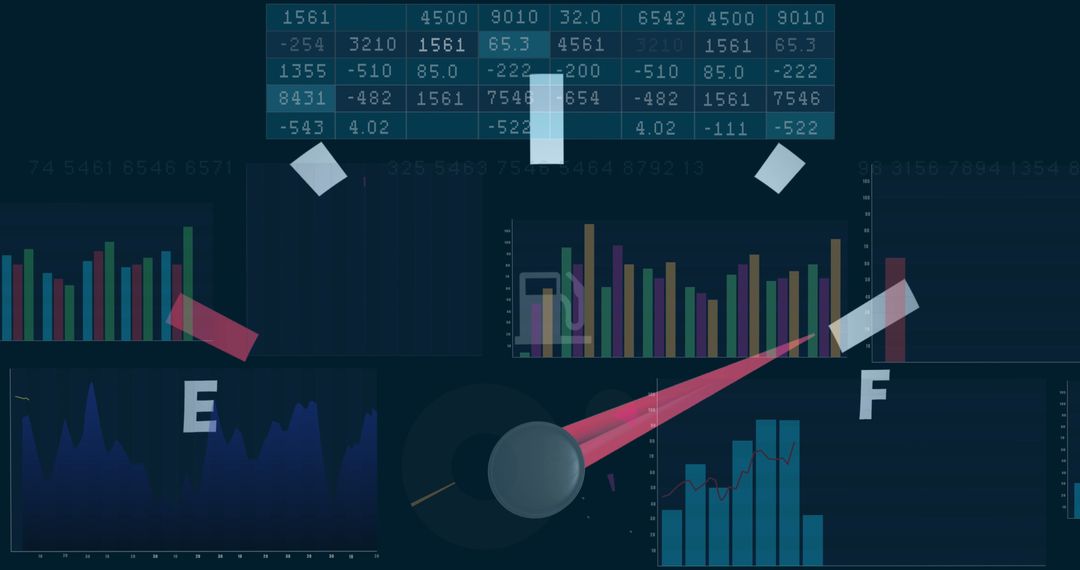
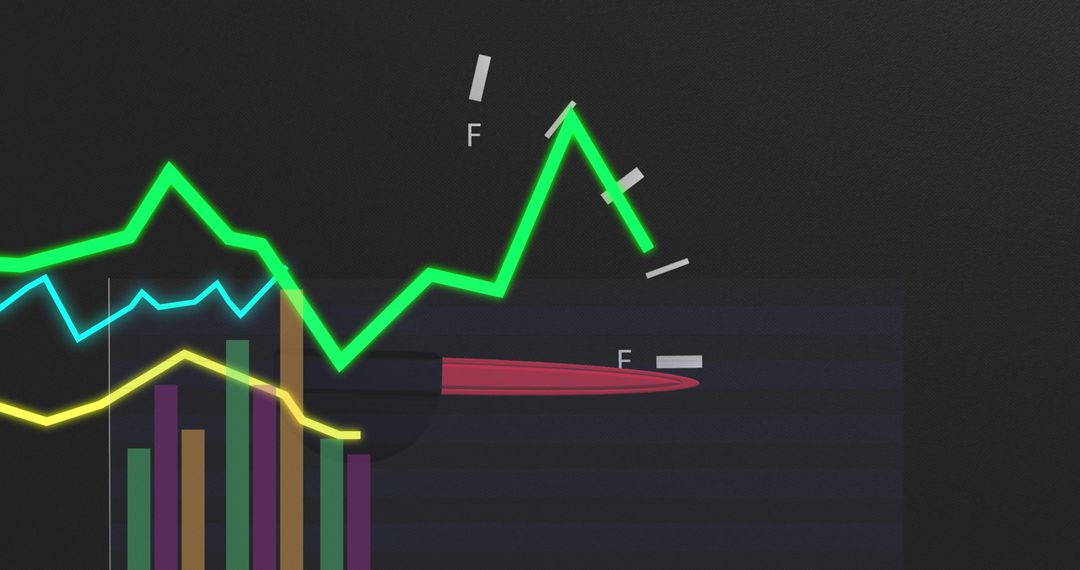
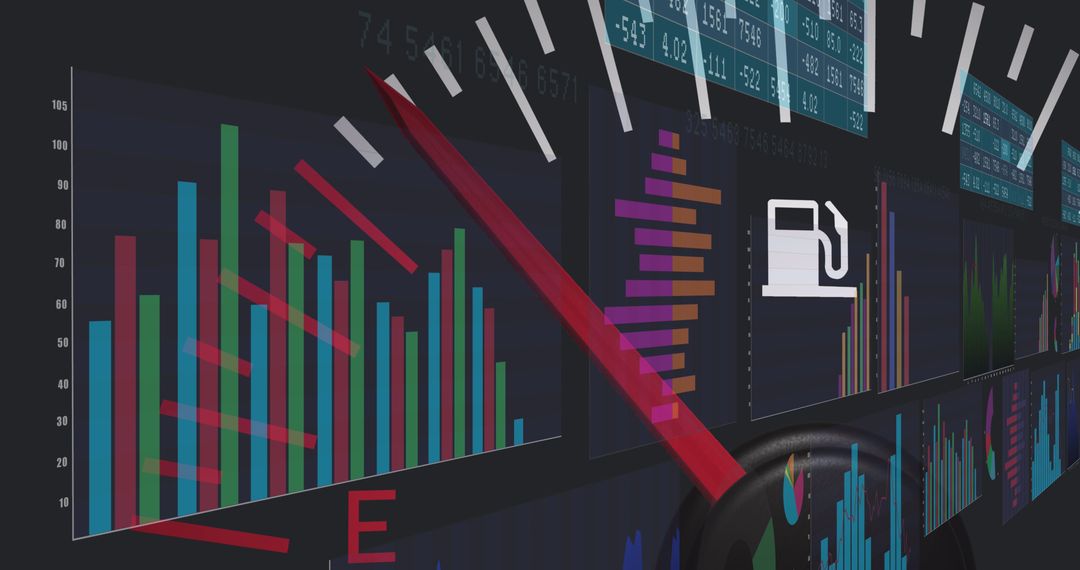
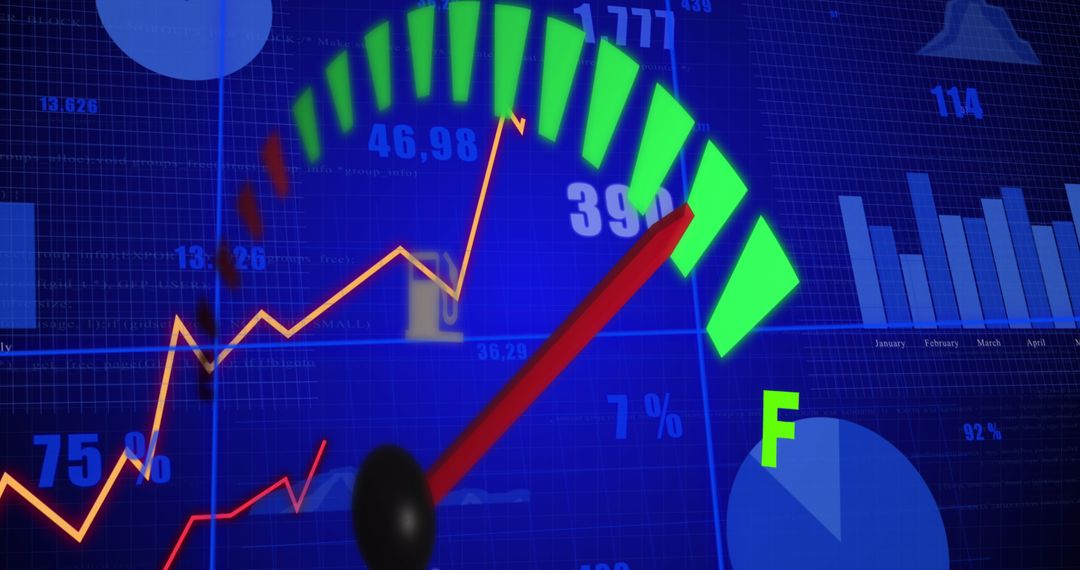
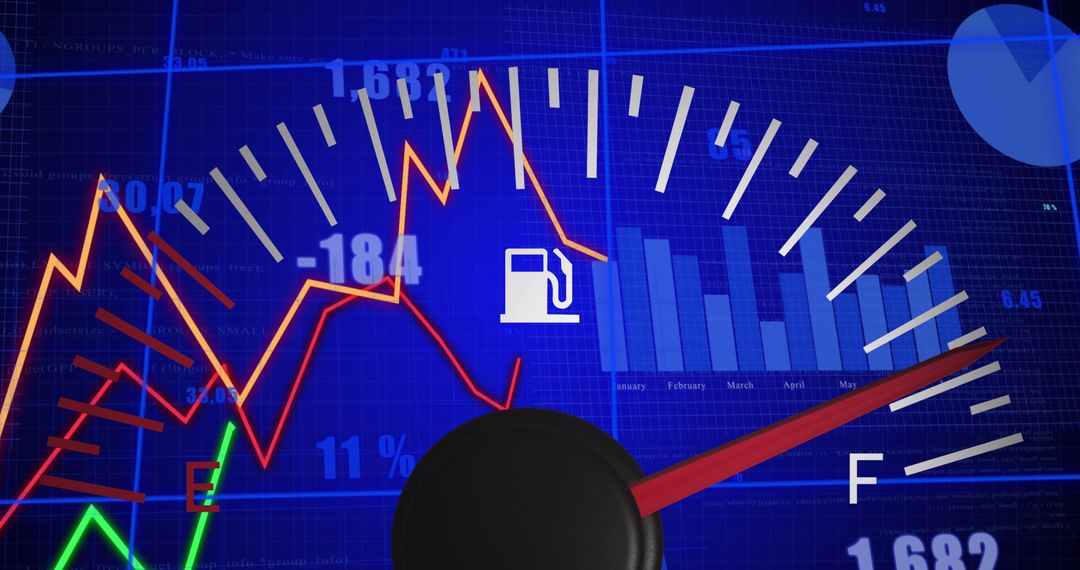
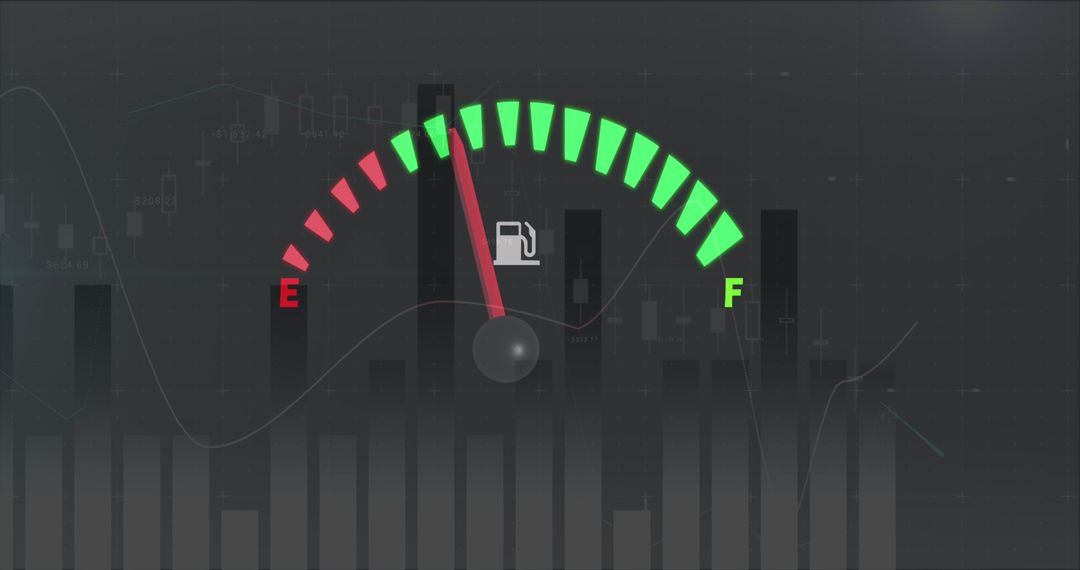
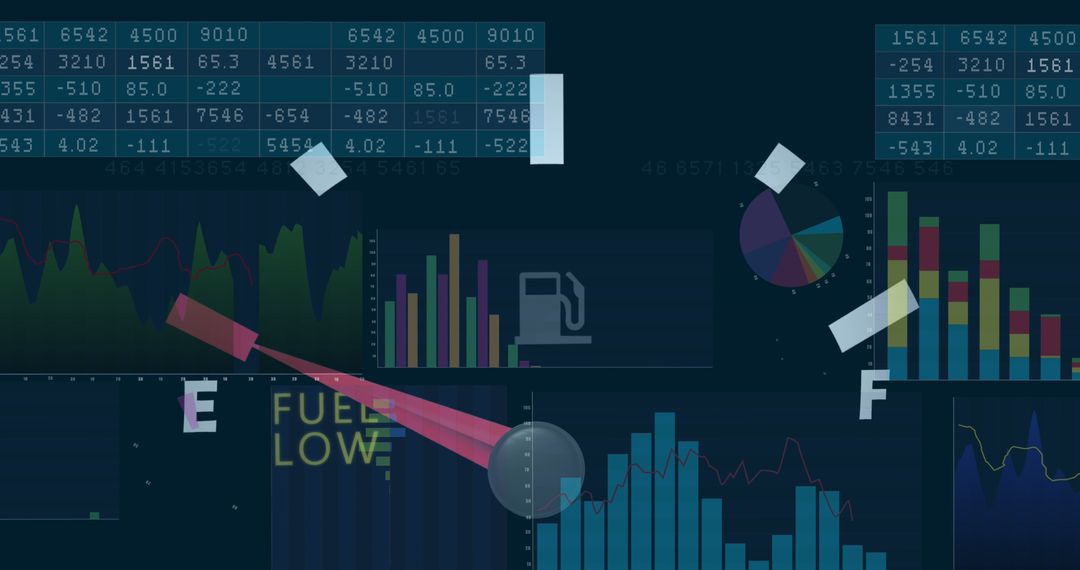
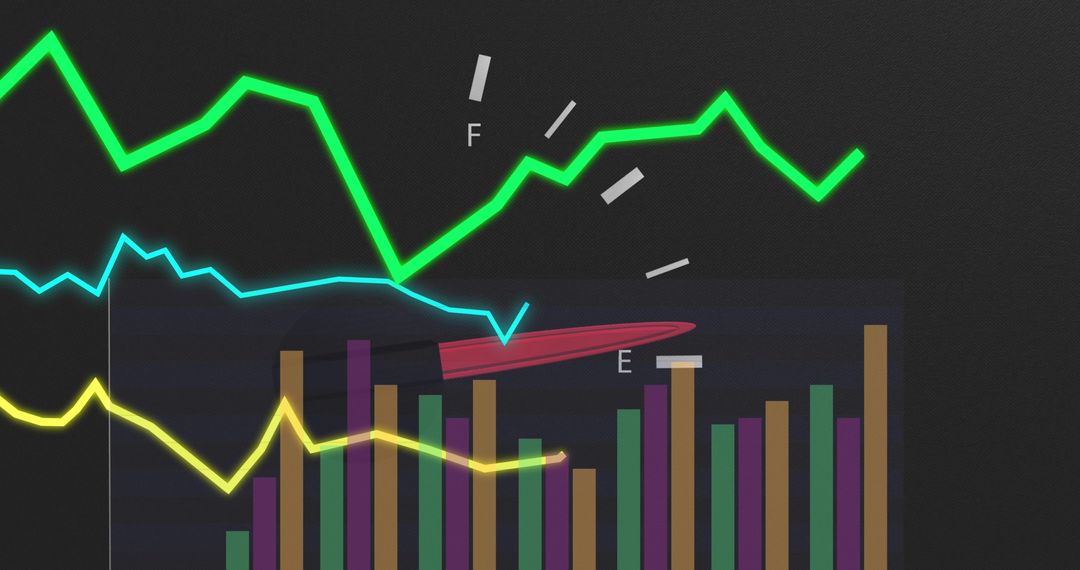
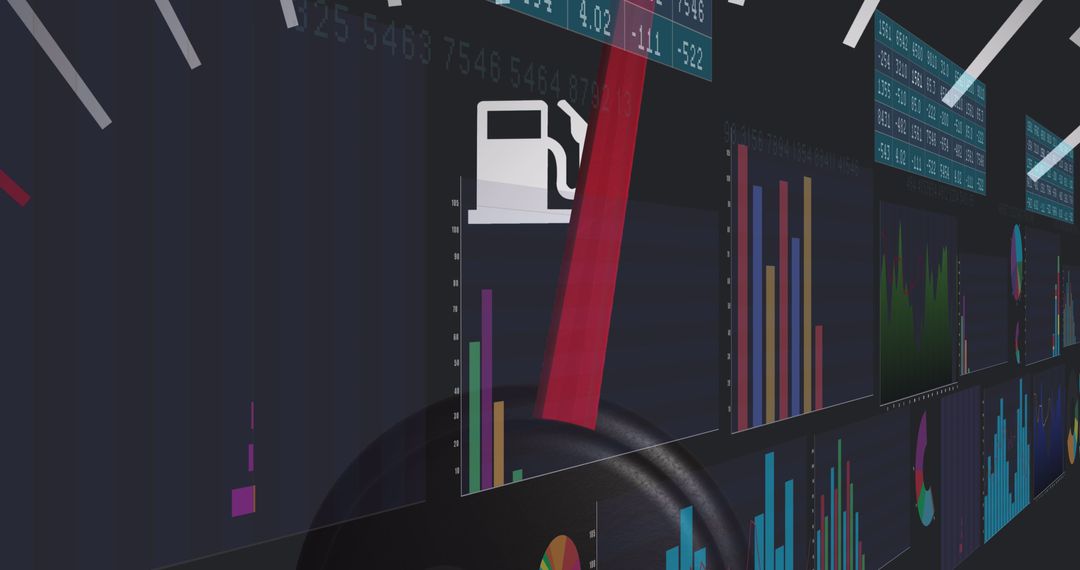
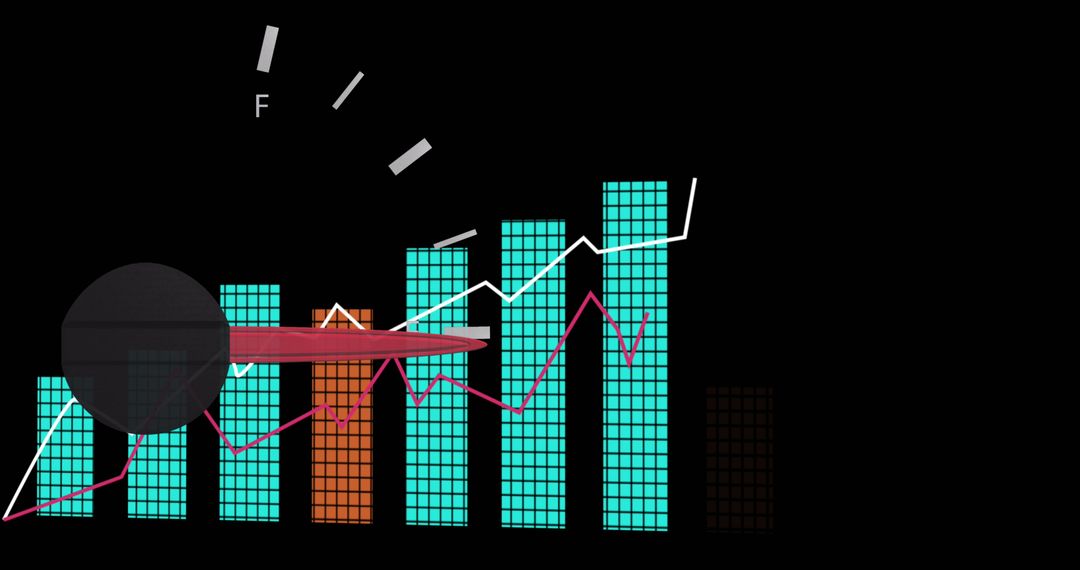
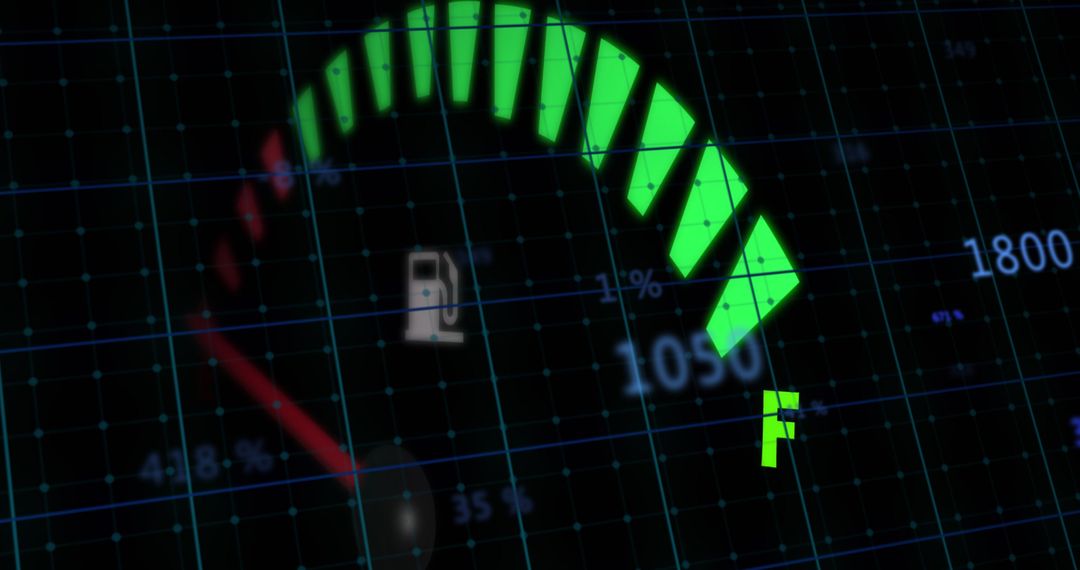
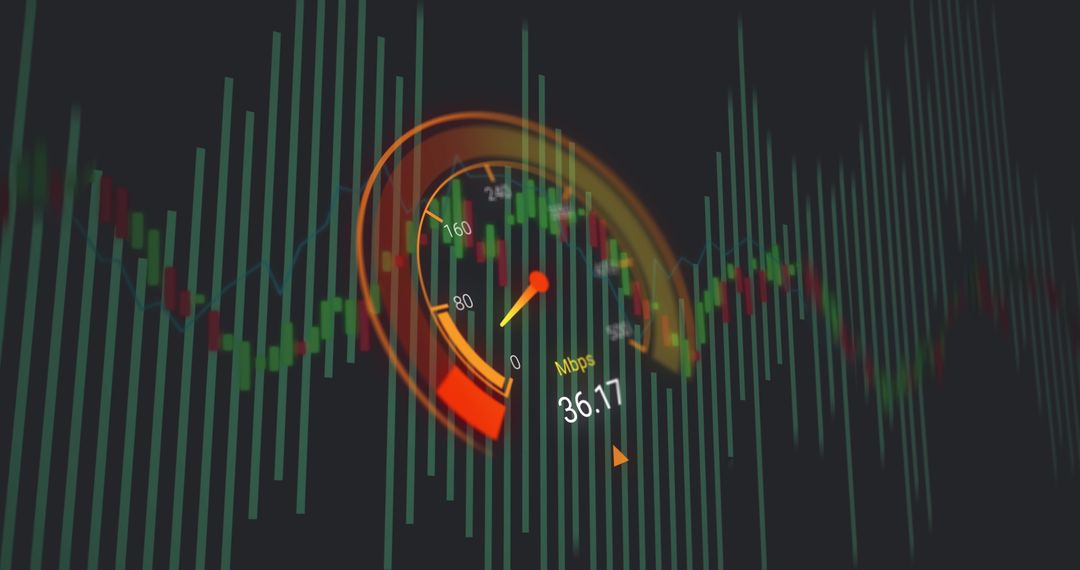
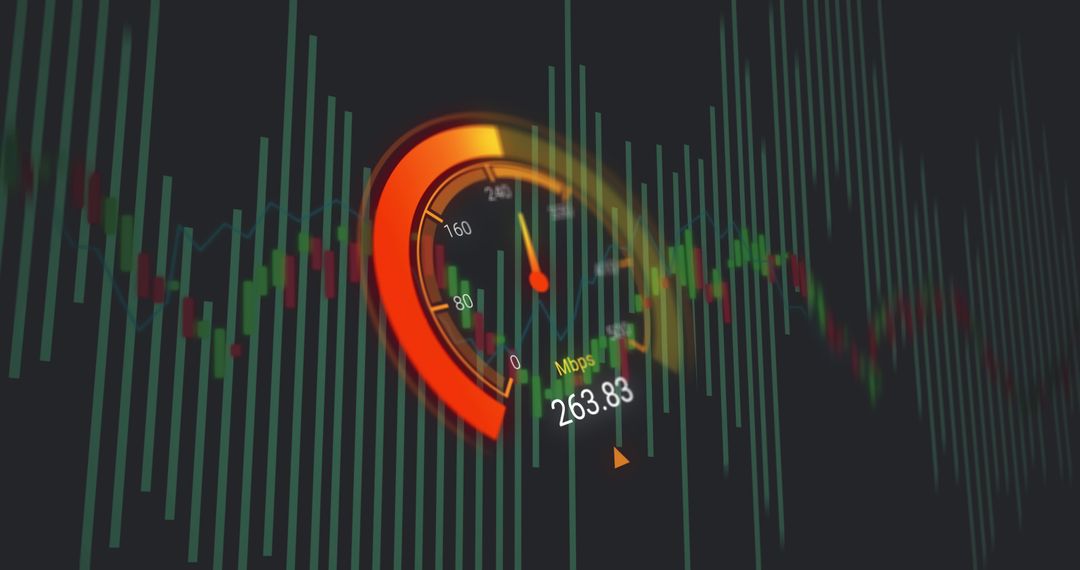
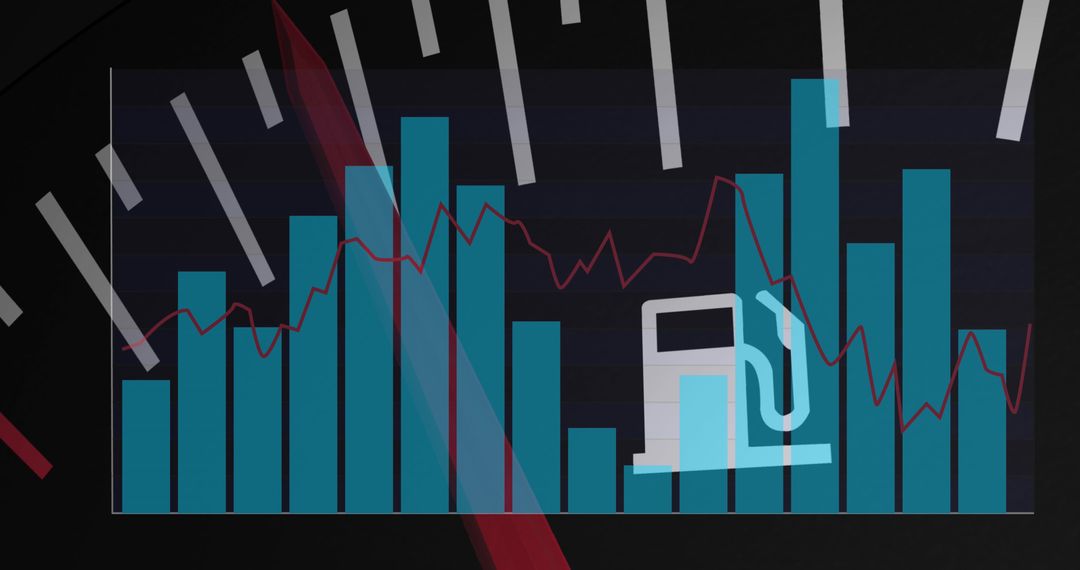
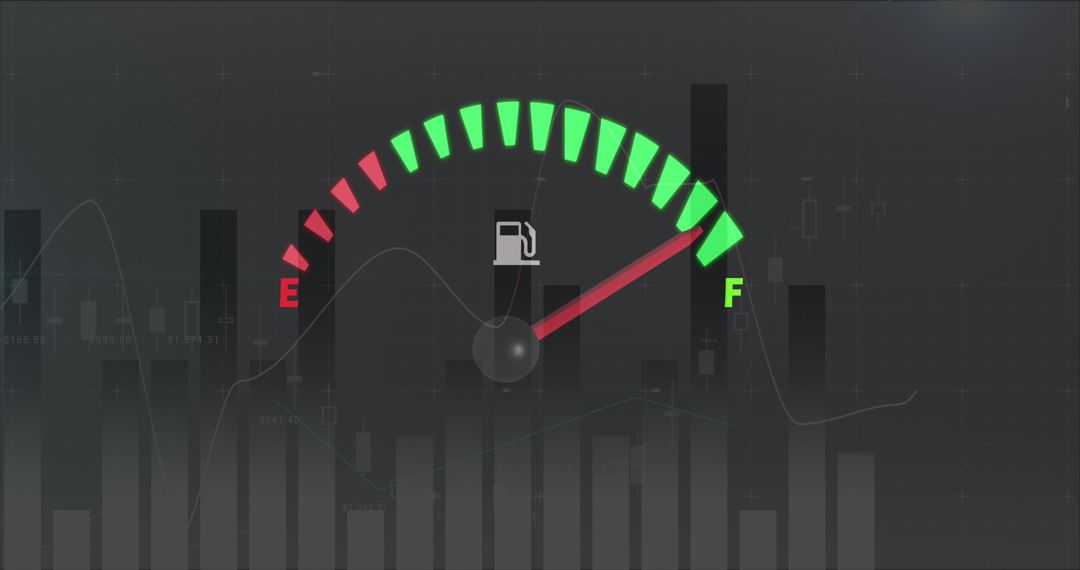
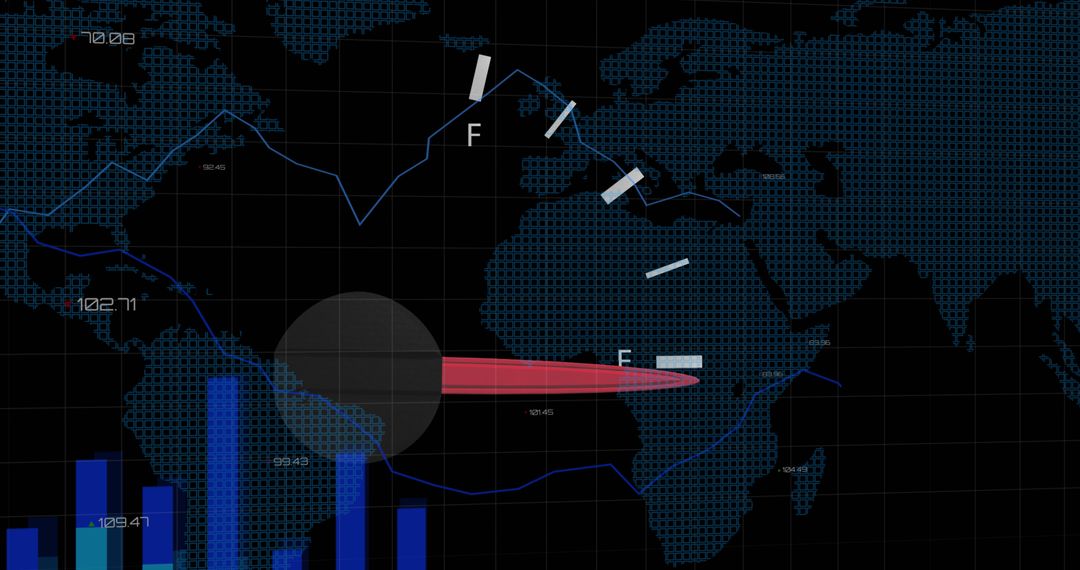
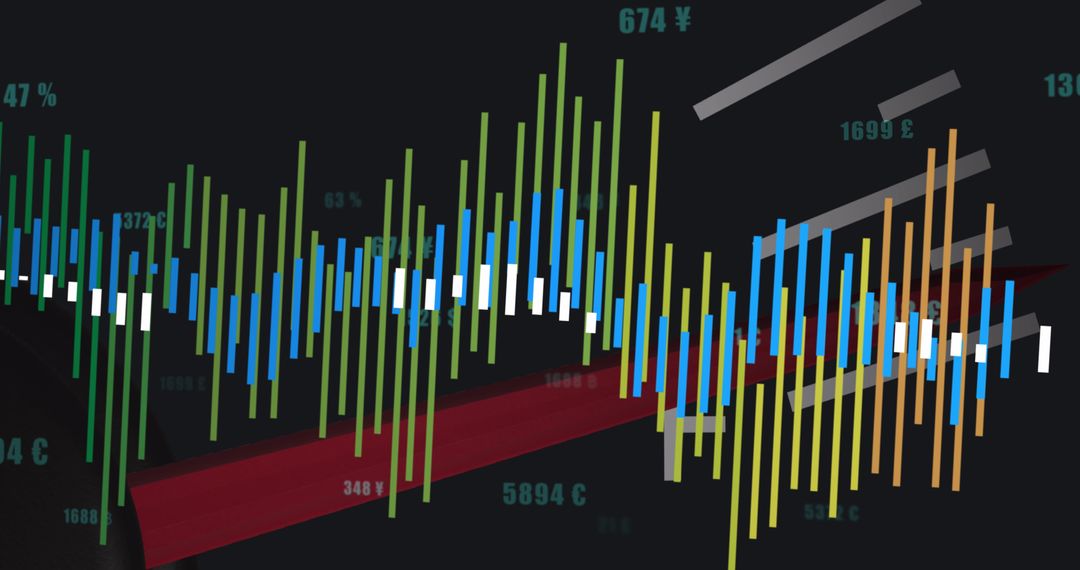
Vibrant visualization of financial data appearing over car dashboard imagery, combining automotive design with global business and technology themes. Suitable for representations in financial technology or automotive industry advancements. Ideal for illustrating digital interfaces connected with transportation tech or investment activities.
Powered by  - Get 15% off with code: PIKWIZARD15


2
downloads
downloads
Tags:
More
Credit Photo
If you would like to credit the Photo, here are some ways you can do so
Text Link
photo Link
<span class="text-link">
<span>
<a target="_blank" href=https://pikwizard.com/photo/digital-data-processing-overlaid-on-car-dashboard/330989fe39180ebbac2b3c2a8783ca2d/>PikWizard</a>
</span>
</span>
<span class="image-link">
<span
style="margin: 0 0 20px 0; display: inline-block; vertical-align: middle; width: 100%;"
>
<a
target="_blank"
href="https://pikwizard.com/photo/digital-data-processing-overlaid-on-car-dashboard/330989fe39180ebbac2b3c2a8783ca2d/"
style="text-decoration: none; font-size: 10px; margin: 0;"
>
<img src="https://pikwizard.com/pw/medium/330989fe39180ebbac2b3c2a8783ca2d.jpg" style="margin: 0; width: 100%;" alt="" />
<p style="font-size: 12px; margin: 0;">PikWizard</p>
</a>
</span>
</span>
Free (free of charge)
Free for personal and commercial use.
Author: Authentic Images
Similar Free Stock Images