
- Home >
- Stock Photos >
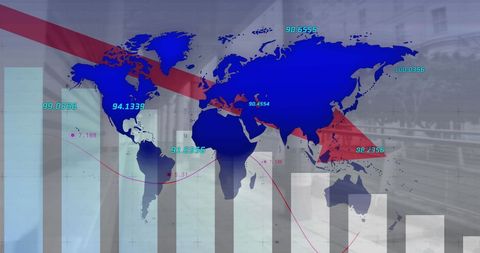
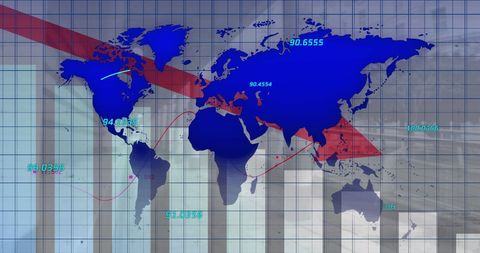
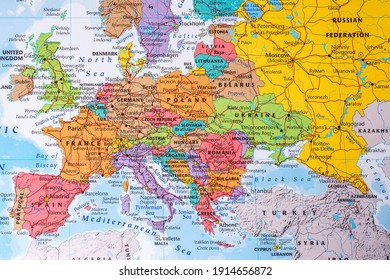
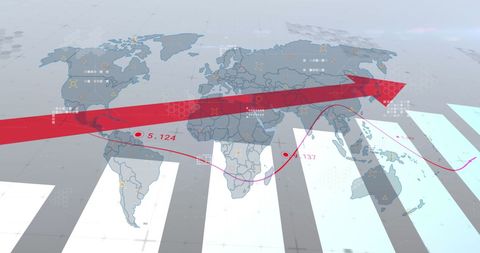
- Digital Data Processing Overlay on European Map
Digital Data Processing Overlay on European Map Image

This design features a digital collage blending statistical graphs with a map of Europe. Suitable for concepts related to global finance, data analytics, and business strategy. Ideal for presentations, financial reports, and industry forecasts emphasizing digital and economic concepts.
Powered by  - Get 15% off with code: PIKWIZARD15


downloads
Tags:
More
Credit Photo
If you would like to credit the Photo, here are some ways you can do so
Text Link
photo Link
<span class="text-link">
<span>
<a target="_blank" href=https://pikwizard.com/photo/digital-data-processing-overlay-on-european-map/b5d8d8f6ce4b28fa87d15a062a47f524/>PikWizard</a>
</span>
</span>
<span class="image-link">
<span
style="margin: 0 0 20px 0; display: inline-block; vertical-align: middle; width: 100%;"
>
<a
target="_blank"
href="https://pikwizard.com/photo/digital-data-processing-overlay-on-european-map/b5d8d8f6ce4b28fa87d15a062a47f524/"
style="text-decoration: none; font-size: 10px; margin: 0;"
>
<img src="https://pikwizard.com/pw/medium/b5d8d8f6ce4b28fa87d15a062a47f524.jpg" style="margin: 0; width: 100%;" alt="" />
<p style="font-size: 12px; margin: 0;">PikWizard</p>
</a>
</span>
</span>
Free (free of charge)
Free for personal and commercial use.
Author: People Creations
Similar Free Stock Images

Premium

Premium


Premium


Premium


Premium


Premium


Premium


Premium


Premium


Premium


Premium


Premium


Premium


Premium


Premium


Premium


Premium


Premium


Premium

Premium


Premium

Premium

Premium


Premium


Premium

Explore More Free Stock Images